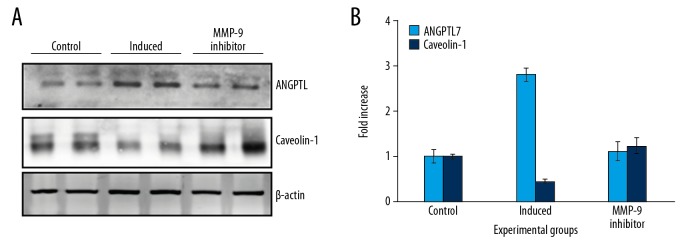
Figure 4.
Western blot analysis of ANGPTL and caveolin proteins in the control and the experimental group of cells. (A) Representative western blots showing the protein expression. (B) The densitometry analysis of proteins normalized to β-actin expression. Values are expressed as means±standard error (SE) (n=6 in each group). Statistical significance expressed as * P<0.05; ** P<0.01 compared to respective control.

