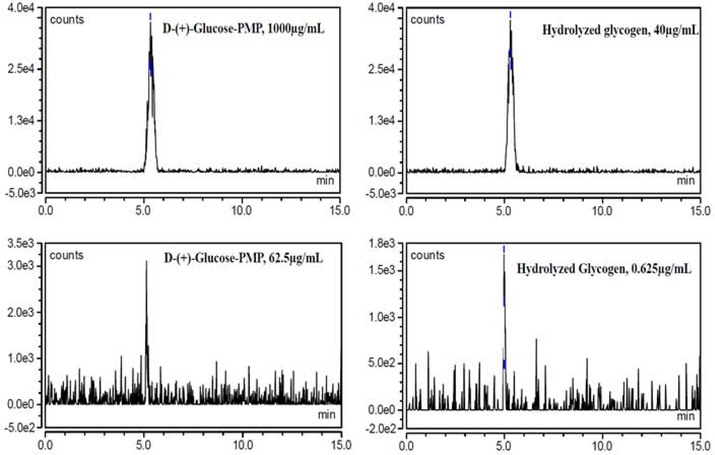
Figure 7. Extracted chromatograms at m/z 510.2, Inj. Vol: 2μL.
Extracted chromatograms show peaks with highest and least D-(+)-Glucose-PMP area from standard (at left) and hydrolyzed glycogen (at right) with retention time 5 min. Different concentrations were selected to generate a linear equation for glucose and glycogen.

