Figure 4.
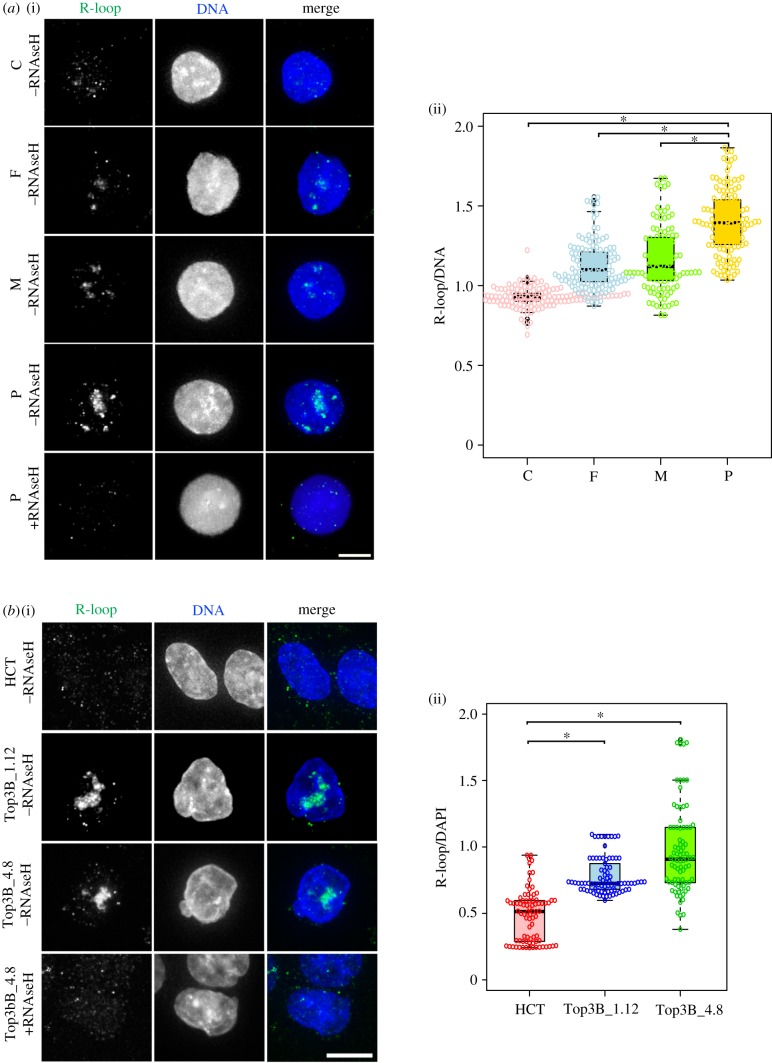
Loss of TOP3B causes R-loop accumulation. (a) (i) Representative images of lymphoblasts (homozygous control, C; heterozygous parental controls, F, M; homozygous TOP3 null patient, P) and (ii) quantification of R-loop intensity. Significant differences were observed for C versus P, F versus P, M versus P, C versus F and C versus M (p < 0.05), but not at F versus M (p > 0.05). (b) (i) Representative images of wild-type HCT116 (HCT) and homozygous TOP3B null controls (Top3B_1.12 and Top3B_4.8) and (ii) quantification of R-loop intensity. R-loops were stained with the S9.6 antibody (green) and DNA with DAPI (blue). As a control, TOP3B null cells were treated with RNaseH, which disrupts R-loops and causes S9.6 staining to disappear, confirming the specificity of the antibody for R-loops. R-loop intensity was determined as S9.6 intensity relative to DAPI intensity. A significant increase for both the TOP3B null patient (top right) and HCT116 TOP3B null clones (bottom right) was observed. Data are from three independent experiments, with at least 200 cells measured at each experiment. Asterisk denotes p < 0.05. Scale bar, 5 µm.

