Figure 5.
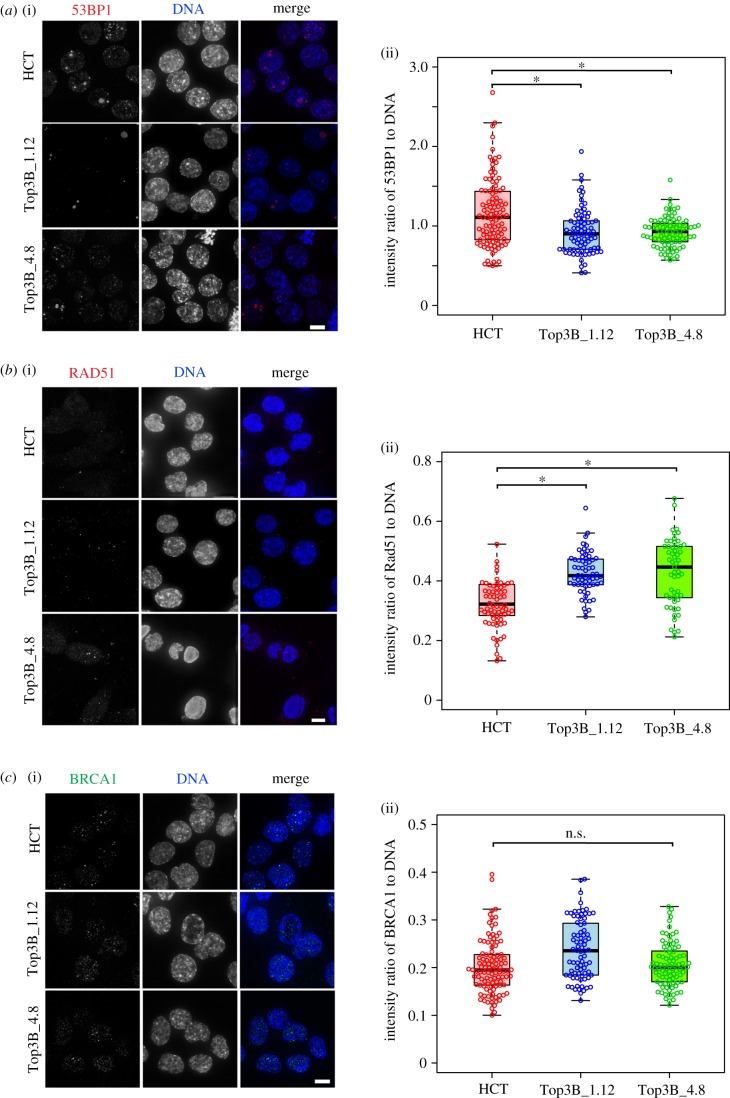
Altered DNA damage response in HCT116 TOP3B-deficient cells. (a) (i) Representative images of cells stained for 53BP1 (red) and DNA (DAPI, blue). (ii) Quantification reveals a decrease in the intensity ratio of 53BP1 to DAPI in TOP3B null clones (Top3B_1.12 and Top3B_4.8) relative to control HCT116 cells (HCT). (b) (i) Representative images of cells stained for RAD51 (red) and DNA (DAPI, blue). (ii) Quantification reveals an increase in the intensity ratio of RAD51 to DAPI in TOP3B null clones relative to control HCT116. (c) (i) Representative images of cells stained for BRCA1 (green) and DNA (DAPI, blue). (ii) Quantification in the intensity ratio of BRCA1 to DAPI between control and TOP3B null cells. Data are from three independent experiments, with at least 200 cells measured for each experiment. Asterisk denotes p < 0.05. n.s., no significant difference. Scale bar, 5 µm.

