Figure 6.
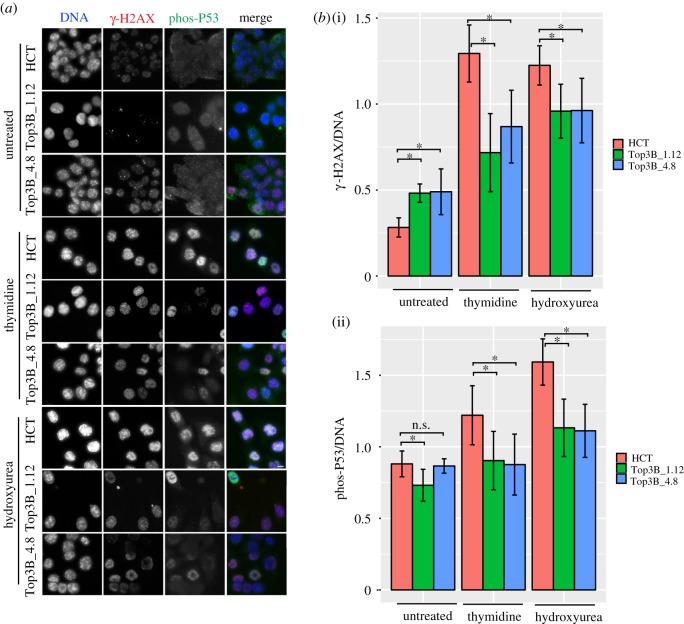
DNA damage response of HCT116 TOP3B null cells treated with replication stress agents. (a) Representative images of HCT116 control (HCT) and TOP3B null clones (Top3B_1.12 and Top3B_4.8) untreated and treated with thymidine or hydroxyurea, co-stained for γ-H2AX (red) and phospho-P53 (green). (b) Quantification of the intensity ratio for (i) γ-H2AX to DAPI and (ii) phospho-P53 to DAPI on HCT116 control and HCT116 TOP3B null cells treated with thymidine or hydroxyurea. Data are from three independent experiments, with at least 200 cells measured for each experiment. Asterisk denotes p < 0.05. n.s., no significant difference. Scale bar, 5 µm.

