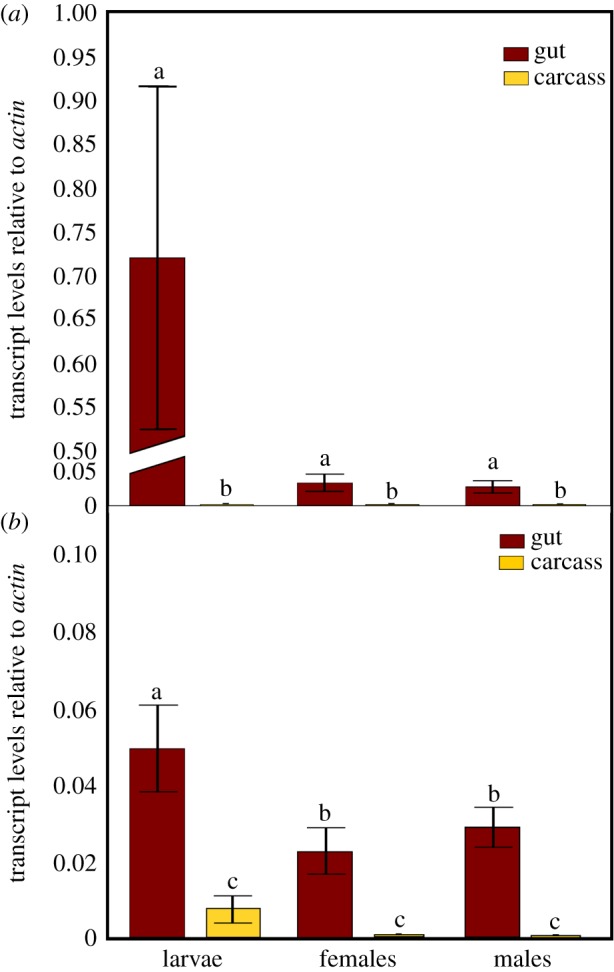
Figure 1.

Transcript levels of (a) dsRNase1 and (b) dsRNase2 genes, relative to actin, in gut or carcass of larvae or adults (males and females) of B. tryoni. Values represent the means and standard errors of three biological replicates; different letters indicate significant differences using ANOVA with Tukey's post hoc test, p < 0.05.
