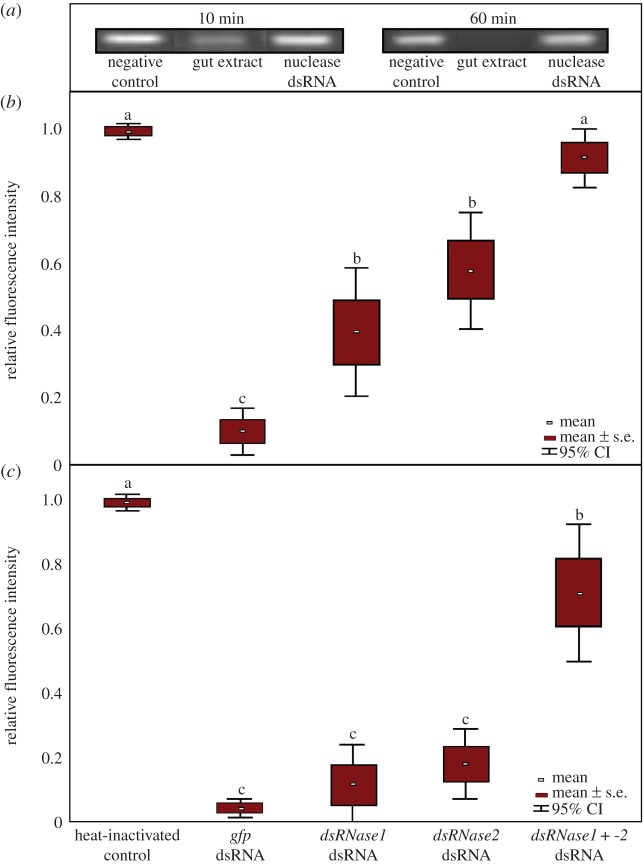
Figure 2.
Degradation of gus-dsRNA incubated in B. tryoni gut contents in adults injected with 1 μg of dsRNA targeting the gut-specific nucleases dsRNase1 and dsRNase2. DsRNAs exposed to gut contents were resolved on agarose gels and Image Lab software was used to determine band fluorescence intensity. (a) Representative gel images of dsRNA at 10 and 60 min exposure to gut extracts. Lane 1 = gus-dsRNA not exposed to gut extracts; lane 2 = gus-dsRNA exposed to gut extracts, showing considerable or complete degradation at 10 and 60 min, respectively; lane 3 = gus-dsRNA exposed to gut extracts of flies injected 24 h earlier with a mixture of dsRNase1- and -2-specific dsRNAs, showing no or little digestion. (b) Box plot display of gel band fluorescence intensities of gut extracts mixed with dsRNA for 10 min from adults collected 24 h post dsRNA injection. (c) Box plot display of dsRNA band intensities following a 60 min exposure to gut extracts from adults collected 24 h post dsRNA injection. The means and standard deviations of eight replicate samples are presented. Different letters denote statistically different means (ANOVA with Tukey's post hoc test, p < 0.05).

