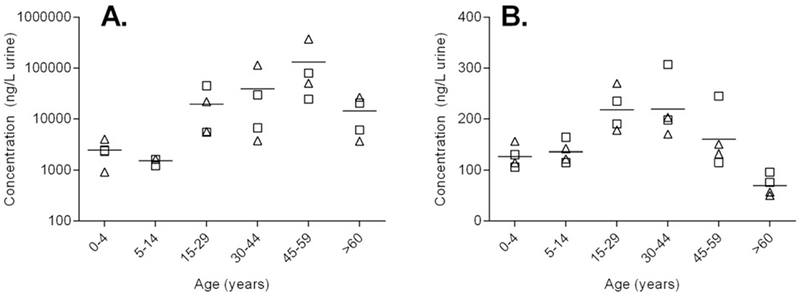
Fig. 1.

Urinary concentration versus age (years) for 1-NAP (A, ng/L) and 1-PYR (B, ng/L). Triangles denote female pools, squares denote male pools. Horizontal line indicates mean concentration of four pools in each age strata. Note log axis for 1-NAP.
