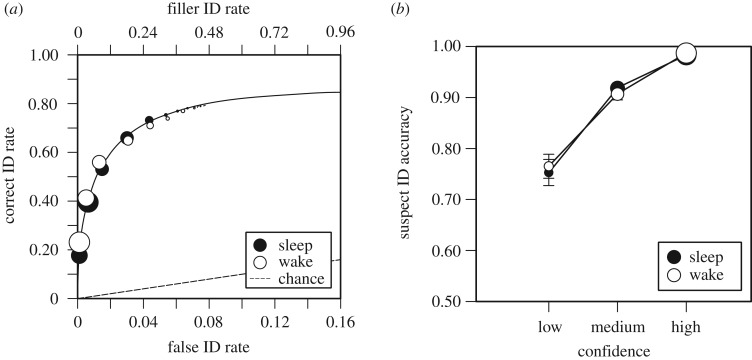
Figure 1.
(a) ROC curves for sleep and wake groups. The operating points represent the data and the curves represent signal detection model fits. The overall filler ID rates from target-absent line-ups are shown on the top x-axis, and the estimated false ID rates are shown on the bottom x-axis. (b) CACs for sleep and wake groups. The size of the points represents relative frequencies of responses, and the bars represent standard errors.

