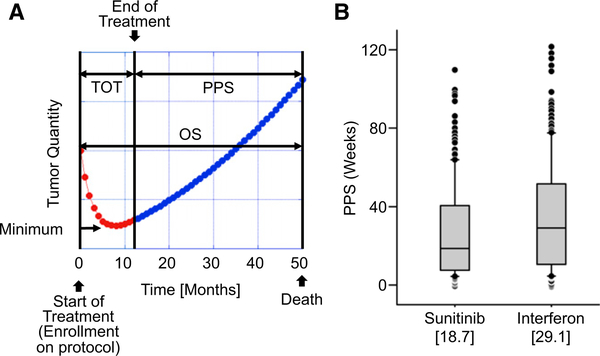
Figure 1. Definitions and Overall Results.
(A) Example of time course of tumor regression and growth in a “typical” patient receiving sunitinib and visual representation of terms used. The red symbols depict the actual tumor quantities measured while the patient was enrolled in the clinical trial. The blue symbols depict an estimation of tumor quantity after treatment was discontinued. Abbreviations are as follows: TOT, time on treatment; PPS, postprotocol survival; OS, overall survival.
(B) PPS for patients randomized to receive sunitinib and those randomized to receive interferon alfa. The differences are statistically significant at p = 0.006.

