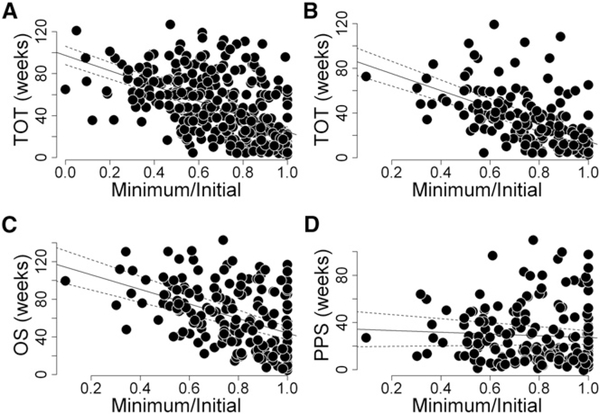
Figure 3. Tumor Response and Treatment Outcomes.
(A–D) Correlations between tumor response to sunitinib assessed as the ratio (Minimum/Initial) of the minimal tumor quantity (Minimum) measured while receiving therapy to the initial tumor quantity (Initial) at the start of therapy and either TOT (A, all patients, and B, all patients with date of death as in C and D), OS (C), or PPS (D). The data demonstrate the lack of an effect of sunitinib efficacy assessed as the ratio Minimum/Initial on PPS (Rsq = 0.0099, p = 0.1837), but modest effects on TOT (Rsq = 0.31, p < 0.001 for both A and B) and OS (Rsq = 0.21, p < 0.001).

