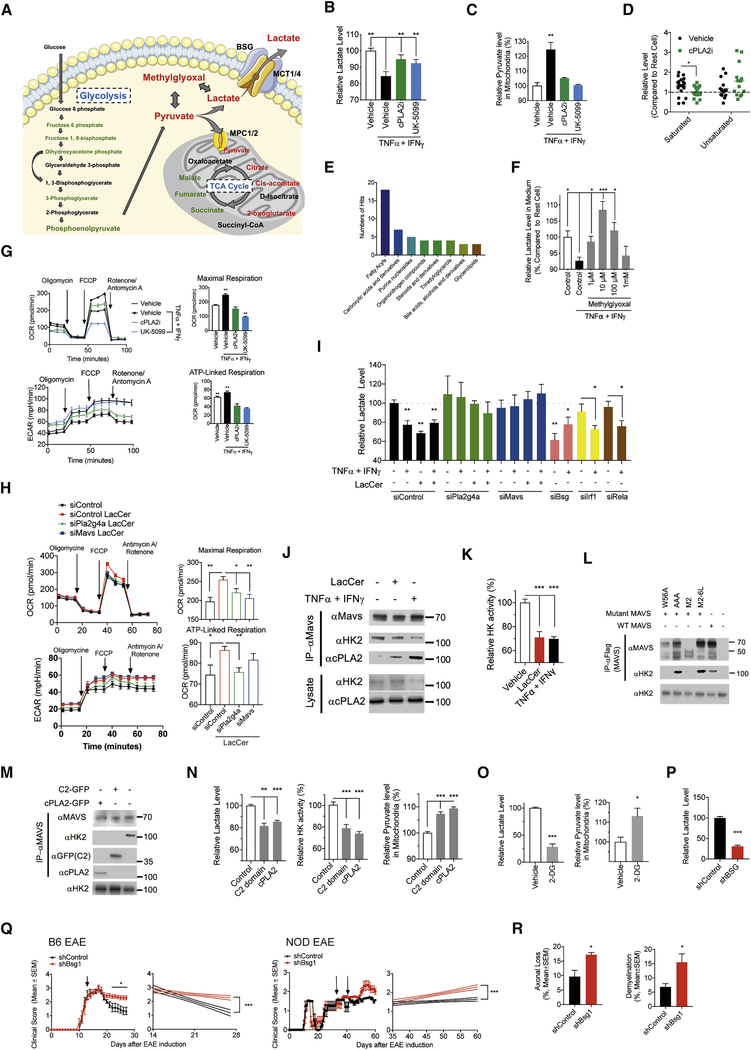
Figure 5: cPLA2-MAVS signaling modulates astrocyte metabolism.
(A) Level change of glucose metabolism in activated astrocytes measured by metabolomic profiling. Green color indicates metabolites decreased by cPLA2i treatment, red color indicates increased metabolites, black color indicates metabolites for which no data were collected. (B, C) Effect of cPLA2 (cPLA2i) or MPCs (UK-5099) inhibition in astrocyte on lactate release (B, unpaired T test, compared to activated vehicle condition, normalized to naive vehicle condition) and pyruvate level in mitochondria (C, unpaired T test, compared to activated vehicle condition, normalized to naive vehicle condition). (D,E) Metabolomic profiling analysis of activated astrocytes in the presence of cPLA2i. (D) Effect of cPLA2 inhibition on saturated and unsaturated fatty acids level in activated astrocyte, shown relative to their levels on resting astrocytes. Each dot indicates a different fatty acid. (unpaired T test, compared to activated vehicle condition) (E) Metabolite categories altered by cPLA2i treatment. (F) Effect of methylglyoxal supply on lactate release by activated astrocytes. (unpaired T test, compared to activated control condition) (G) Effect of cPLA2 or MPCs inhibition in mitochondrial function of astrocyte analyzed by Mito Stress test assay. (unpaired T test, compared to all) (H,I) Effect of gene targeted siRNA knockdown in mitochondrial function of LacCer loaded astrocytes analyzed by Mito Stress test assay (H, unpaired T test, compared to all) and lactate release by astrocytes (I, unpaired T test, compared to naive siControl condition). (J) Effect of LacCer loading or cytokines stimulation on the interaction of MAVS with HK2 and cPLA2 in astrocyte, evaluated by pull-down assay and western blot. (K) Mitochondrial HK enzymatic activity in activated astrocytes. (unpaired T test, compared to vehicle condition) (L) MAVS binding domain analysis. Flag-tagged human MAVS (Full length, M2–6L, M2, AAA or W56A) was over-expressed in HEK293 cell and 24 hours later MAVS protein complexes were pulled down and analyzed by western blot. (M) Human cPLA2 (cPLA2-GFP or C2 domain-GFP respectively) were over-expressed in HEK293 cell and 24 hours later MAVS protein complexes were pulled down and analyzed by western blot. (N) Effect of cPLA2 or cPLA2 C2 domain overexpression in HEK293 cells on mitochondrial HK enzymatic activity, lactate release and mitochondrial pyruvate levels. (unpaired T test, compared to Control condition) (O) Effect of 2-DG treatment on lactate release and mitochondrial levels of pyruvate in astrocyte. (unpaired T test) (P) Lactate release by Bsg knockdown or control astrocytes. (unpaired T test) (Q) EAE development in C57BL/6 or NOD mice that received lentiviral constructs to knockdown Bsg in astrocytes at the time points indicated by the arrows. (n≥7, N = 2, Regression slope T test). (R) Axonal loss and demyelination in spinal cords from NOD EAE mice. (unpaired T test)

