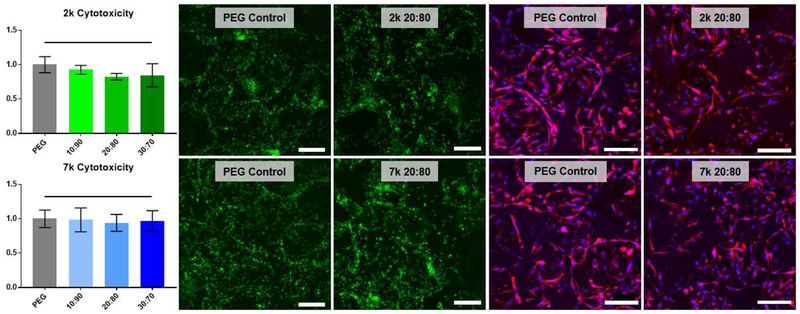
Figure 5.
Scaffold non-cytotoxicity after 48 hr culture with hBMSCs, as determined by LDH assay (left), SYBR green stain (middle) and rhodamine phalloidin (red) and DAPI (blue) stacked confocal images (right). Statistically significant difference compared to the control is represented as * = p <0.05. The complete set of images can be found in Fig. S6. All templated SIPS PDMSstar-PEG and analogous PEG-DA control scaffolds were prepared with medium salt (~270 μm). Scale bars = 200 μm.

