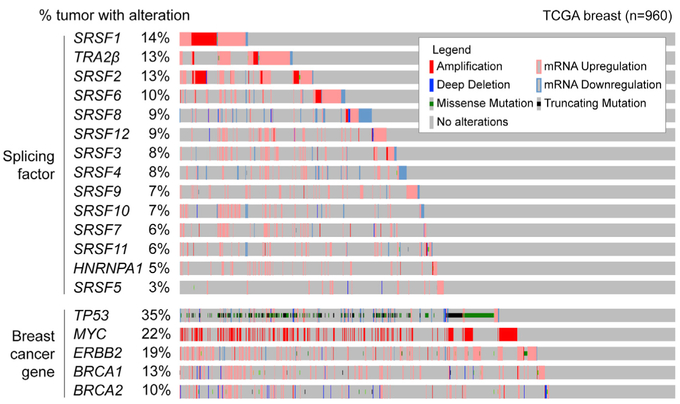
Figure 1. SF Alterations Are Detected Frequently in Human Breast Tumors.
Graphical representation of SF alterations in TCGA human breast tumors (n = 960) sorted by frequency. CNVs and expression changes are assessed by DNA-and RNA-seq. Individual genes are represented as rows and patients as columns. Alterations in breast cancer genes BRCA1, BRCA2, TP53, MYC, and ERBB2 are in the bottom panel.
See also Figure S1.

