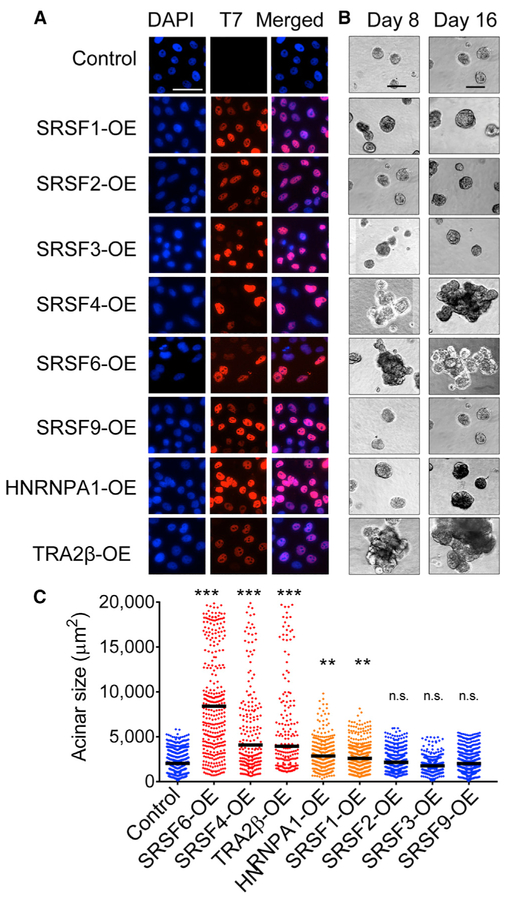
Figure 2. Specificity of SF-Mediated Transformation.
(A) Expression of T7-tagged SFs in MCF-10A cells, detected by immunofluorescence using T7-tag antibody and DAPI nuclei co-stain (scale bar: 50 μm).
(B) Representative bright-field images of acinar size and morphology for control and SF-OE 3D MCF-10A cells on days 8 and 16 (scale bar: 100 μm).
(C) Quantification of acinar sizes in control and SF-OE 3D MCF-10A cells on day 16. The dot plot shows the size distribution of all of the structures and the median (horizontal line) for each condition (n = 4, >50 acini per experiment; t test, **p < 0.001, ***p < 0.0001; n.s., not significant).
See also Figure S3.

