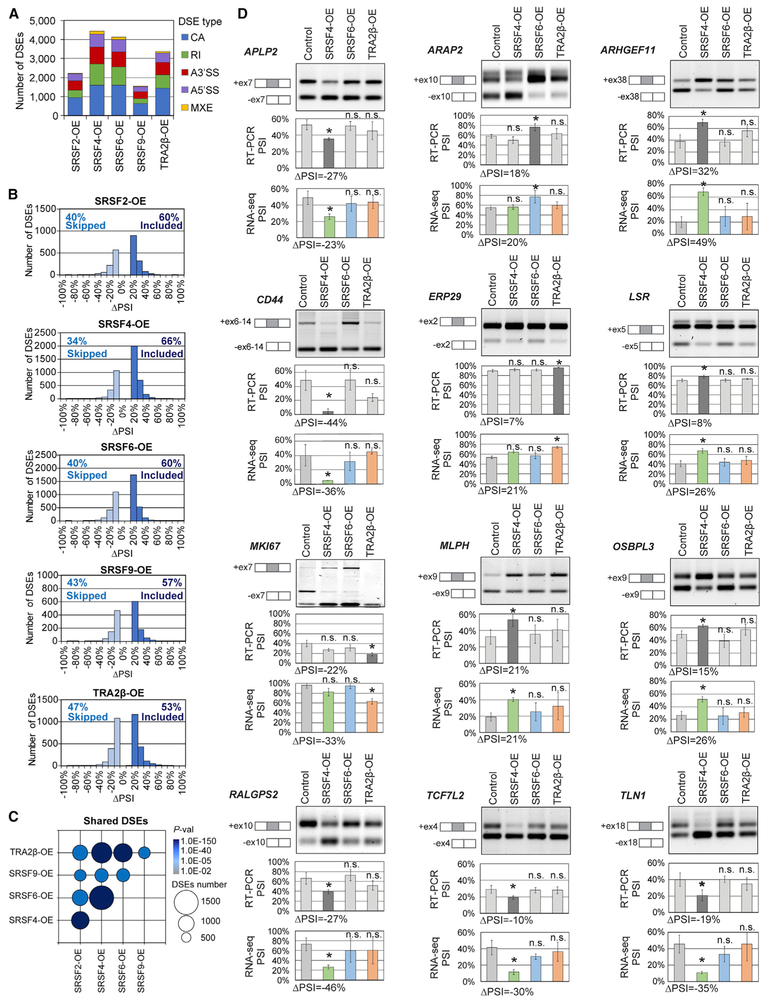
Figure 3. SF Overexpression Is Associated with Differentially Spliced Events in MCF-10A.
(A) DSEs detected by RNA-seq in SF-OE versus control MCF-10A day 8 acini (n = 3; ∣ΔPSI∣ ≥ 10%, false discovery rate [FDR] < 5%, p < 0.01), sorted by AS event types. CA, cassette exon; MXE, mutually exclusive exon; RI, retained intron; A5′SS, alternative 5′SS; A3′SS, alternative 3′SS.
(B) Skipped (ΔPSI ≤ −10%) and included (ΔPSI R 10%) DSEs in SF-OE versus control are plotted by ΔPSI values for each SF for all AS event types.
(C) Overlap in DSEs for each SF pair. Bubble size is proportional to the number of shared DSEs and color indicates p values.
(D) RT-PCR validations of DSEs. A representative gel is shown, along with isoform structures. PSI for all samples and ΔPSI for significant SFs are calculated from RT-PCR (n = 3; mean ± SD; t test, *p < 0.05, n.s., not significant) and RNA-seq.

