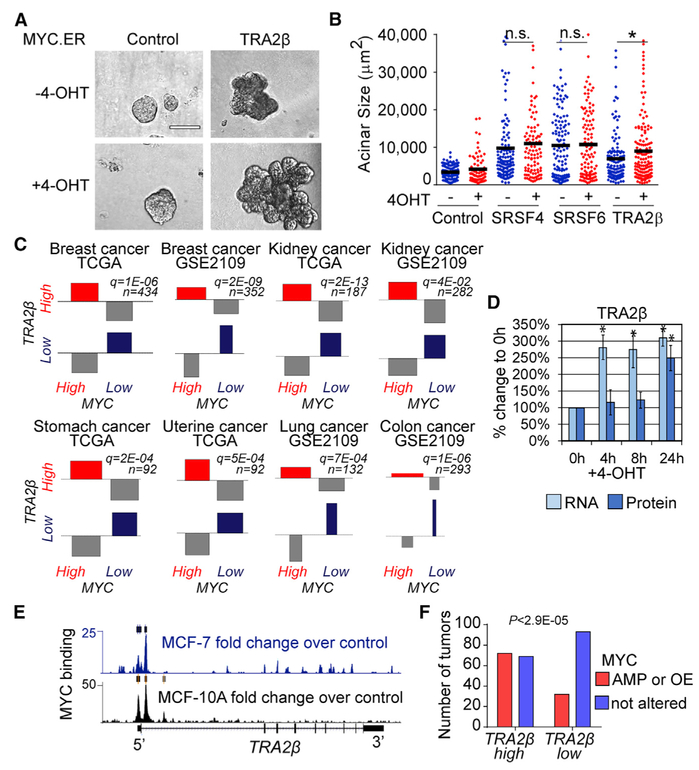
Figure 4. Cooperation of TRA2β with the MYC Oncogene in Breast Cancer.
(A) Representative bright-field images of control or TRA2β-OE 3D MCF-10A acini expressing estrogen receptor ligand-binding domain (ER)-inducible MYC, activated by 4-hydroxytamoxifen (4-OHT) (scale bar: 100 μm).
(B) Acinar size distribution and median (horizontal line) of SRSF4-, SRSF6-, TRA2β-OE MYC.ER MCF-10A ± 4-OHT (n ≥ 3, >100 acini per condition; t test, *p < 0.01, n.s., not significant).
(C) Association plot showing the correlation between MYC and TRA2β expression in human tumors. Dataset identification numbers (IDs) and numbers of samples are indicated. MYC and TRA2β expression are grouped into four categories: (1) both high, (2) TRA2β high and MYC low, (3) TRA2β low and MYC high, and (4) both low.
(D) The TRA2β RNA and protein levels in MYC.ER MCF-10A +4-OHT at indicated time points are measured by qRT-PCR and western blotting (n = 3; mean ± SD; t test, *p < 0.05). RNA levels are normalized to GAPDH and HPRT; protein levels are normalized to tubulin.
(E) MYC binding to TRA2β genomic region as detected by MYC ChIP-seq experiments in MCF-7 and MCF-10A cells. Fold changes over control are calculated from pooled replicates; significant peaks are shown by rectangles.
(F) MYC amplification (AMP) or OE status inTRA2β-high versus TRA2β-low breast tumors.

