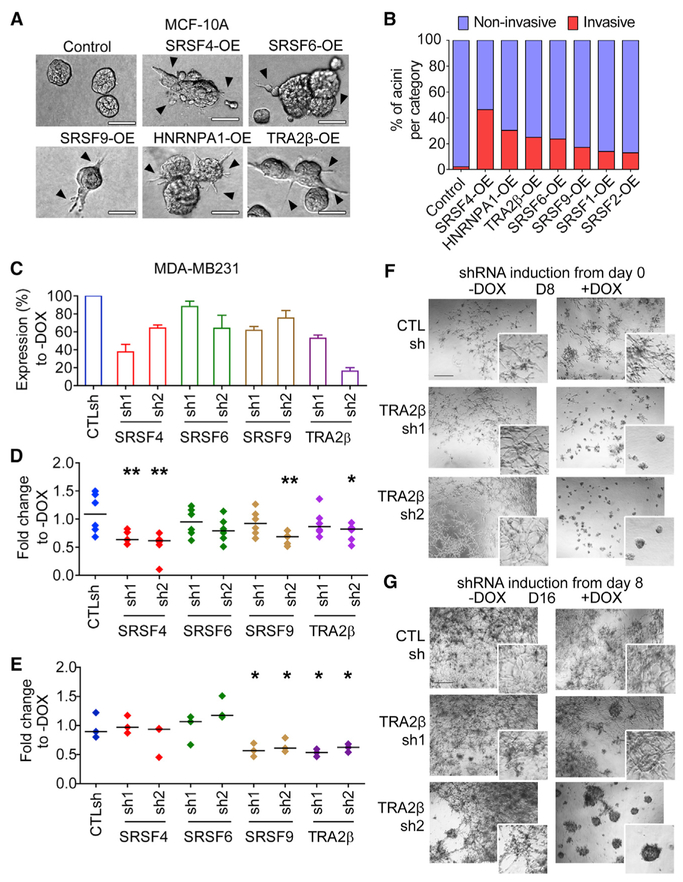
Figure 5. Differential Roles of SFs in Cell Migration and Invasion.
(A) Representative bright-field images of acinar morphology for control or SF-OE 3D MCF-10A cells grown in Matrigel-collagen invasion assay at day 8. Multicellular protrusions and inter-acinar bridges are indicated by arrowheads (scale bar: 50 μm).
(B) Percentage of invasive versus non-invasive acini at day 8 (n = 3, >50 acini per condition).
(C) SF levels in MDA-MB231 expressing scrambled CTLsh or SF-targeting shRNAs are quantified 72 h after DOX treatment by western blotting using SF-specific antibodies and normalized to tubulin. Percentage of SF in +DOX is normalized to the corresponding −DOX (n = 3; mean ± SD).
(D and E) Migration of CTLsh or SFsh MDA-MB231 ± DOX in 2D wound-healing (D) or transwell assay
(E). Distribution and median (horizontal line) for each condition +DOX normalized to −DOX (n = 3; t test, *p < 0.05, **p < 0.005).
(F and G) Representative bright-field images of CTLsh or TRA2βsh MDA-MB231 cells, grown in 3D ± DOX (scale bar: 100 μm). DOX is added from either day 0 (F) or day 8 (G).
See also Figures S5 and S6.

