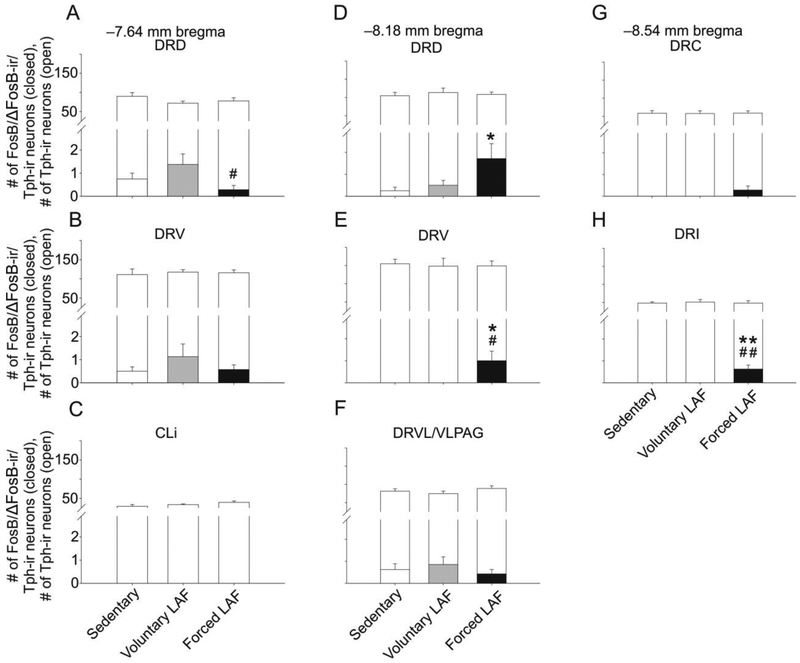
Fig 11.
Graphs illustrating numbers of FosB/ΔFosB-immunoreactive (ir)/tryptophan hydroxylase- (Tph-) ir cells from different rostrocaudal levels of the rat dorsal raphe nucleus (DR) in Experiment 2. Foreground bars represent the numbers of FosB/ΔFosB-ir/Tph-ir neurons. Background bars represent the total numbers of Tph-ir neurons (both FosB/ΔFosB-immunoreactive/Tph-immunoreactive neurons and FosB/ΔFosB-immunonegative/Tph-immunoreactive neurons) within each subdivision. Graphs are arranged (A-H) according to rostrocaudal level in mm from bregma. Abbreviations: CLi, caudal linear nucleus; DRC, dorsal raphe nucleus, caudal part; DRD, dorsal raphe nucleus, dorsal part; DRI, dorsal raphe nucleus, interfascicular part; DRV, dorsal raphe nucleus, ventral part; DRVL/VLPAG, dorsal raphe nucleus, ventrolateral part/ventrolateral periaqueductal gray; LAF, Lafayette. *p < 0.05. **p < 0.01. Sedentary versus Forced LAF exercise. #p < 0.05, ##p < 0.01 Voluntary LAF exercise versus Forced LAF exercise.

