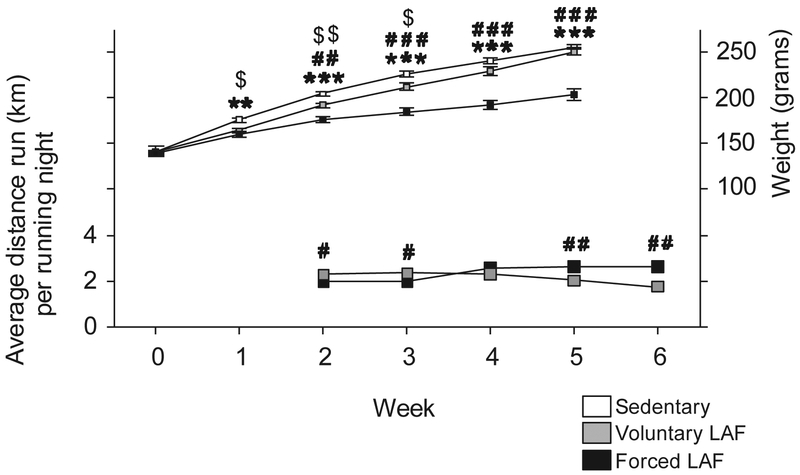
Fig. 7. Body weight and distance run of rats placed in LAF wheels.
The left y-axis depicts distance run per night by rats in LAF wheels. Data represent mean ± SEM each week studied. The right y-axis is the body weight throughout the study. **p < 0.01, ***p < 0.001, Sedentary versus Forced LAF exercise; #p < 0.05, ##p < 0.01, ###p < 0.001, Voluntary LAF exercise versus Forced LAF exercise,; $p < 0.05, $$p < 0.01, Sedentary versus Voluntary LAF exercise.

