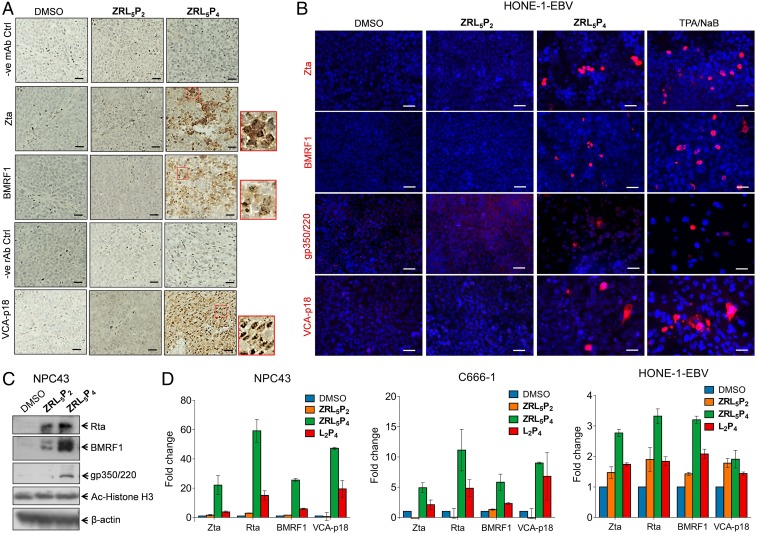
Fig. 5.
EBV lytic induction analysis of EBV-positive tumors and cells in response to the EBNA1 probes. (A) IHC analysis of lytic proteins Zta, BMRF1, and VCA-p18 in the transplanted C666-1–derived tumor tissues as described in Fig. 4 E–G. Representative results are shown. Nuclear and cytoplasmic staining of Zta, BMRF1, and VCA-p18 are observed in response to ZRL5P4. Insets (in the red boxes) are the enlarged images to indicate the cellular localization of the 3 proteins. Negative control staining images are included for the mouse antibodies (mAb) against Zta and BMRF1 and for the rat antibody (rAb) against VCA-p18. Magnification, 400×. (Scale bars, 20 µm.) (B) Representative images of immunofluorescent analysis of EBV lytic proteins, Zta, BMRF1, gp350/220, and VCA-p18 in HONE-1-EBV cells in response to 10 µM ZRL5P2 or ZRL5P4. TPA/NaB (20 ng/mL TPA, 3 mM NaB) serves as a positive control of lytic induction. The presence of these 4 lytic proteins is indicated by red signals. The nuclei were stained with DAPI. (Scale bars, 50 µm.) (C) Western blot analysis of Rta, BMRF1, and gp350/220 EBV lytic proteins in NPC43 cells cultured with or without 10 µM ZRL5P2 and ZRL5P4 for 7 d. Acetylated histone H3 (Ac-Histone H3) was also detected. β-actin serves as the loading control. (D) Gene expression analysis of EBV lytic genes, Zta, Rta, BMRF1, and VCA-p18 in NPC43, C666-1, and HONE-1-EBV cells cultured with or without 10 µM ZRL5P2, ZRL5P4, and L2P4, for 7 (NPC43 cells), 3 (C666-1 cells), or 5 (HONE-1-EBV) d. The gene expression was analyzed by qRT-PCR. The fold change of relative gene expression after each treatment was compared with the solvent control (DMSO). Data are expressed as the means ± CI.

