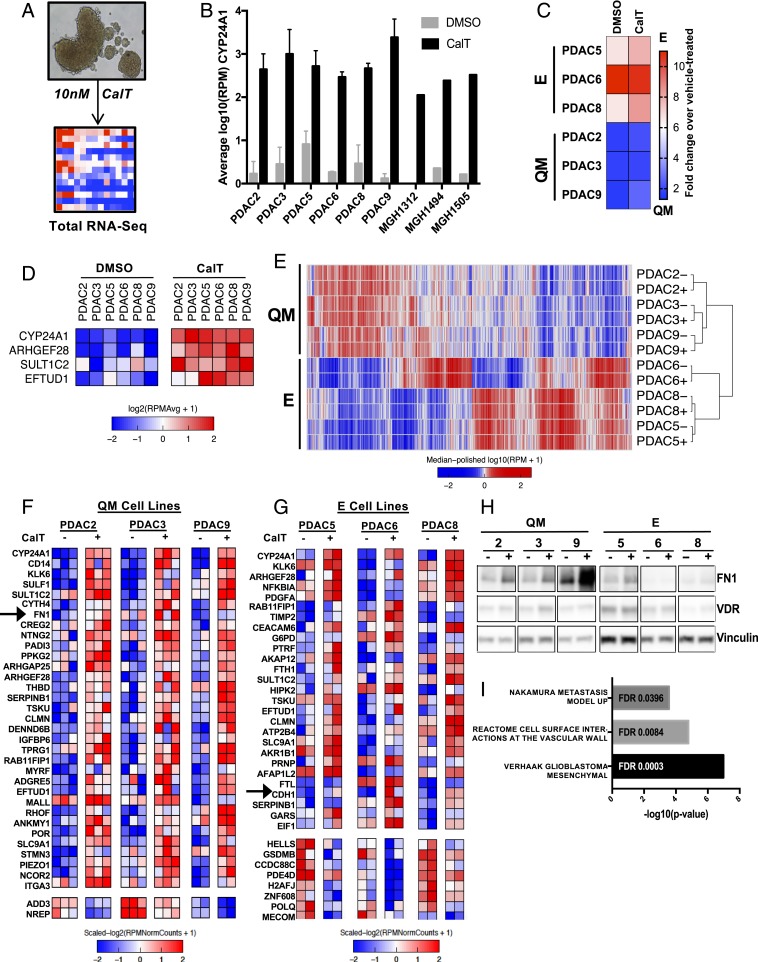
Fig. 2.
E/QM status of PDAC dictates transcriptional response to VDR activation. (A) Schematic of experimental system in which tumor spheroids are grown in 3D culture conditions and dosed with 10 nM CalT or DMSO control on day 0 and day 2. Spheroids are harvested on day 5, and RNA is extracted for total RNA-seq. (B) CYP24A1 expression in a selection of PDAC cell-line spheroids following 5 d of CalT treatment compared with vehicle control as determined by RNA-seq, expressed as log10 reads per million (RPM). Error bars indicate SD. (C) Relative change in E/QM status of each PDAC cell line following 5 d of exposure to CalT expressed as fold change in metascore over vehicle-treated. (D) Expression heatmap of genes differentially expressed upon CalT treatment in all 6 PDAC cell lines. Data represents 2 to 3 independent experiments for each cell line. (E) Unsupervised clustering of RNA-seq data from 6 patient-derived PDAC cell lines at baseline (−) and after treatment with CalT (+). [Scale bar, log10(RPM+1).] (F and G) Expression heatmaps of differentially expressed genes following treatment of QM (F) and E (G) PDAC spheroids with CalT as determined by RNA-seq. Columns represent individual biological replicates. (H) Western blot demonstrating protein levels of FN1 and VDR in PDAC spheroids following treatment of PDAC spheroids with CalT for 5 d. (I) Enriched gene sets of interest from GSEA computing overlaps between CalT-induced genes in QM cell lines and hallmark, curated, and oncogenic signatures gene sets.

