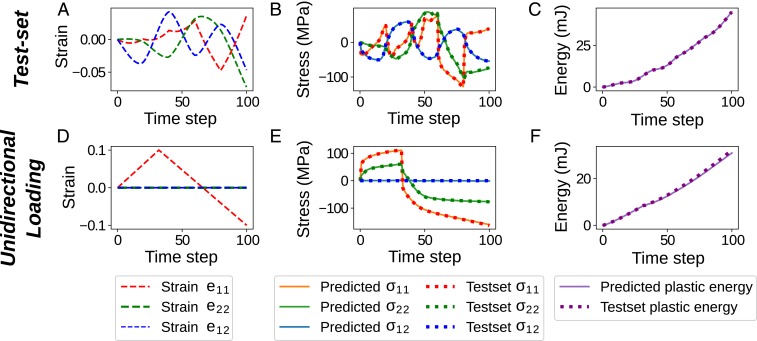
Fig. 4.
Evaluation results for the trained model in case 1. The top row demonstrates the applied average strains (A), the predicted and database average stresses (B), and the predicted and database plastic energies (C) for a test-set sample (unseen in the training process). The bottom row depicts the average strains (D), average stresses (E), and plastic energies (F) for the unidirectional loading test. Note the Poisson effect shown in E since .

