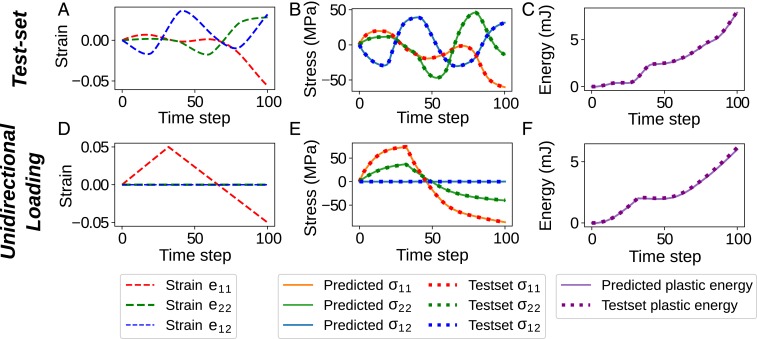
Fig. 7.
Evaluation results for the trained model in case 2 for 2 different RVEs under different loading conditions. The top row (A–C) corresponds to an RVE from the test set (unseen in the training process) that has a microstructure characterized by , shown in SI Appendix, Fig. S2 (RVE A). The bottom row (D–F) corresponds to a different RVE with microstructure characterized by , shown in SI Appendix, Fig. S2 (RVE B) and subjected to a unidirectional loading. The first column (A and D) shows the corresponding applied average strains; the second column (B and E) shows the average stresses predicted by the RNN model (solid line) compared to finite element analyses (dashed line); and the third column (C and F) shows the plastic energies predicted by RNN (solid line) and FEA (dashed line).

