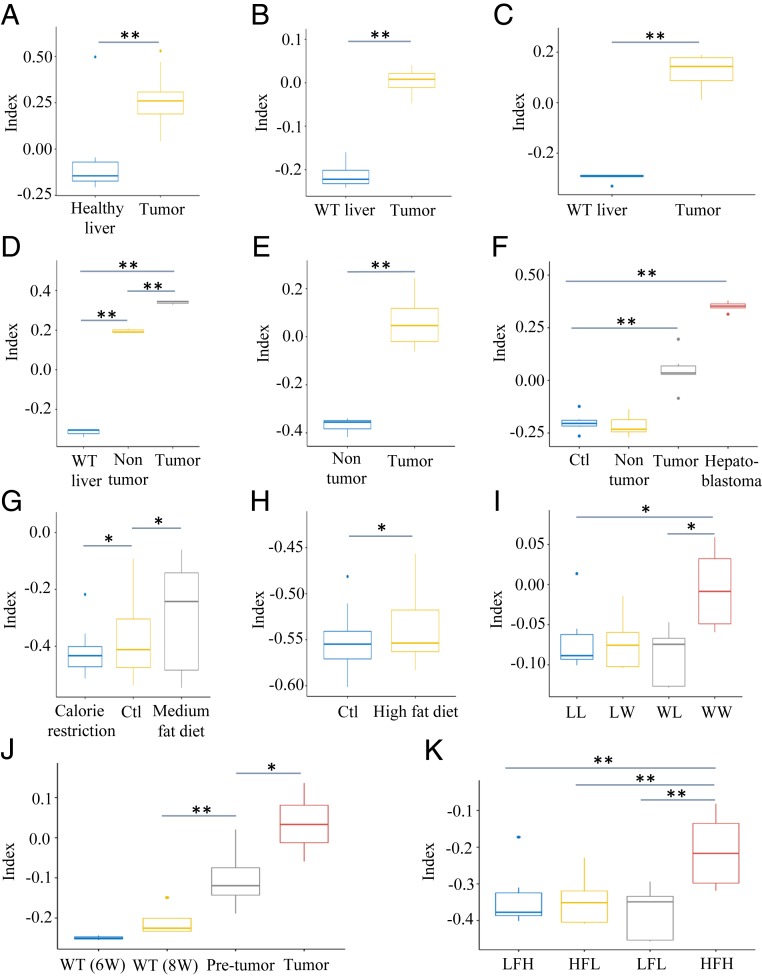
Fig. 4.
TI values of mouse livers with chronic metabolic disorders or tumors of diverse backgrounds. (A) TI values of healthy livers (n = 10) and Mad2 and p53 null liver tumors (n = 29) in dataset GSE63687. (B) WT livers and tumors of ctnnb1 knockout livers in dataset GSE43628 (n = 4). (C) WT livers and tumors of gnmt knockout mice in dataset GSE63027 (n = 5). (D) WT, tumor, and adjacent nontumor samples collected from SART+/− mice in dataset GSE71057 (n = 3). (E) Nontumor and tumor samples from dataset GSE29813 (n = 6). Tumors were spontaneously developed or induced by a transitional Chinese medicine, Ginkgo biloba leaf extract. (F) WT liver, nontumor, tumor, and hepatoblastoma samples from dataset GSE67316. All samples were collected from mice in a single NTP chronic bioassay (n = 6). (G) Liver samples fed calorie restriction diet, control diet, and medium fat diet from dataset GSE84495 (n = 4). (H) Liver samples with control diet or 21-d high-fat diet from dataset GSE43106 (n = 36). (I) Liver samples from dataset GSE44901. Female mice were fed western (W) or low-fat control (L) semisynthetic diet before and during gestation and lactation. At weaning, male offsprings were assigned either W or L diet, generating 4 groups: WW, WL, LW, and LL offsprings (n = 5–6). WW offsprings showed steatohepatitis. (J) Dataset GSE83596 contained WT liver samples at age 6 or 8 wk (n = 3), pretumor (n = 10) and tumor (n = 4) samples collected from a mouse NASH-associated HCC model (STAMTM model). (K) High- or low-fat-diet liver samples from dataset GSE24031. Mice were chronically fed a high-fat (HF) diet to induce NAFLD and compared with mice fed low-fat (LF) diet. Based on histological scoring, mice were divided into 4 subgroups. LF-low (LFL) responders (n = 4) showed normal liver morphology, LF-high (LFH) (n = 6) had benign hepatic steatosis, HF-low (HFL) (n = 4) exhibited pre-NASH, and HF-high (HFH) (n = 4) developed overt NASH. *P < 0.05; **P < 0.01 (Student’s t test).

