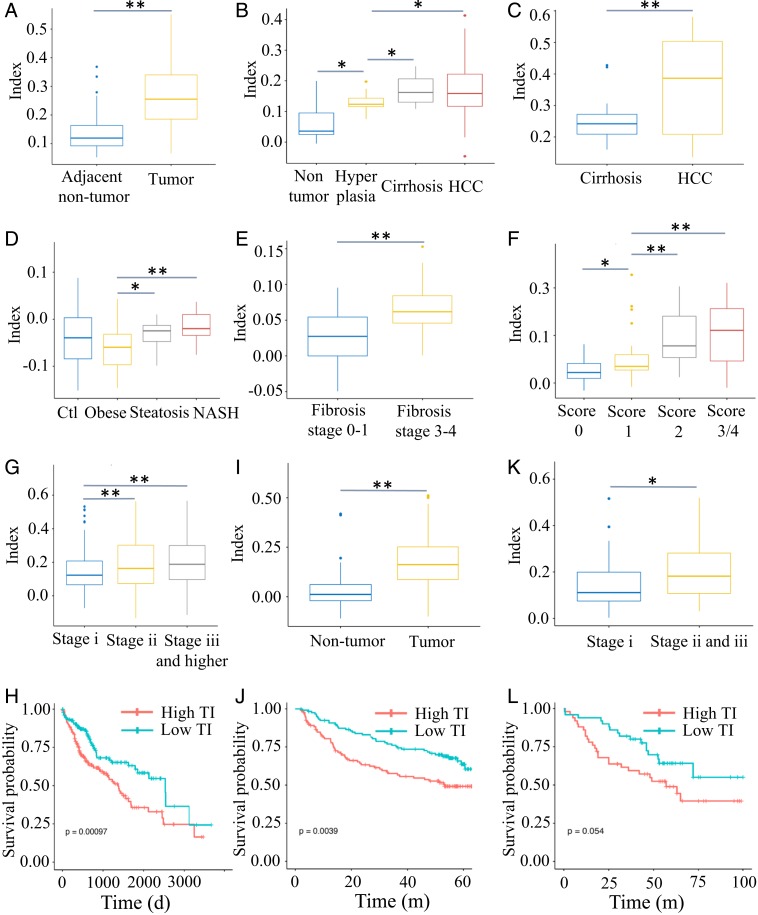
Fig. 5.
TI values of human HCC and precancer patients with steatosis, fibrosis, or NASH. (A) A total of 193 adjacent nontumor liver samples and 240 liver tumor samples were from the GSE36376 dataset. (B) A total of 10 nontumor liver samples, 17 dysplastic liver samples, 13 cirrhotic liver samples, and 35 HCC samples in GSE6764. (C) Cirrhotic liver (n = 34) and HCC (n = 35) samples in GSE56140. (D) Liver samples for control (n = 14), obese (n = 27), steatosis (n = 14), and NASH (n = 18) patients in GSE48452. (E) A total of 72 fibrotic liver samples (fibrosis stages 0–1, n = 40; fibrosis stages 3–4, n = 32) in GSE49541. (F) Hepatitis B virus-related liver fibrosis samples (n = 124) in GSE84044. The pathological Scheuer score of each sample was evaluated, score 0 (n = 43), score 1 (n = 20), score 2 (n = 33), and score 3 and 4 (n = 28). (G) A total of 371 liver tumor samples in the TCGA dataset. Of these, 347 tumor samples had well-documented tumor stages (stage I, n = 171; stage II, n = 86; stage III and more advanced, n = 90). (H) The 371 liver tumor samples in the TCGA dataset were subgrouped at the median TI value (high TI, n = 186; low TI, n = 185), and Kaplan–Meier analysis was done to compare survival for patients with high (red) and low (blue) TIs (log-rank test, P < 0.001). (I) TIs of 445 tumor and nontumor liver samples in GSE14520 (tumor, n = 221; nontumor, n = 224). (J) The 221 tumor samples in GSE14520 were subgrouped at the median TI value (high TI, n = 111; low TI, n = 110), and Kaplan–Meier analysis was done to compare survival for patients with high (red) and low (blue) TIs (log-rank test, P < 0.004). (K) TIs of 100 liver tumor samples in GSE16757. These tumor samples had well-documented tumor stages (stage I, n = 35; stage II and III, n = 65). (L) The 100 tumor samples in GSE16757 were subgrouped at the median TI (high TI, n = 50; low TI, n = 50), with Kaplan–Meier analysis done to compare survival for patients with high (red) and low (blue) TIs (log-rank test, P < 0.05). *P < 0.05; **P < 0.01.

