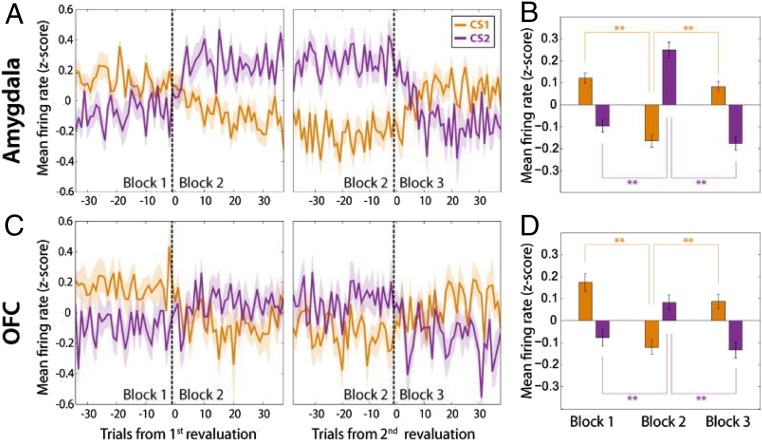
Fig. 2.
Neurons in the amygdala and OFC represent the relative amount of reward associated with a CS. (A) Population average firing rate plotted as a function of trial number for amygdala neurons that responded selectively to the amount of expected reward. (Left) Activity changes in relation to a revaluation of CS1 (orange), which occurs by increasing the reward amount associated with CS2 (purple). (Right) Activity changes in relation to a second revaluation of CS1, which now occurs by decreasing the reward amount associated with CS2. (B) Average firing rate of neurons in A for each block. **P < 0.01 (Wilcoxon sign-rank test). (C and D) Same as A and B, except for neurons recorded in OFC. Adapted from ref. 49, with permission from Elsevier.

