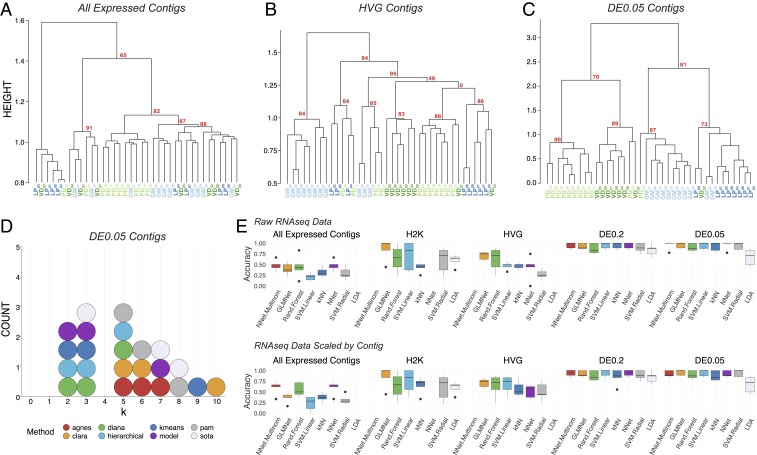
Fig. 2.
Post hoc recapitulation of cell identity via single-cell RNA-seq with hierarchical clustering and sML algorithms. (A) Hierarchical clustering of cell type with correlation as the distance metric, Ward.D2, as the clustering method, and data centered and scaled by contig for all expressed contigs, (B) HVG dataset, and (C) DE contigs at the q < 0.05 level. Each cell type is color coded, and AU P values are noted for each of the major nodes. Cells are identified by type (LP, PD, GM, VD) and a subscript that denotes a unique sample identifier. (D) Dotplot of the top 3 predicted number of clusters (k values) for 8 algorithms. None of these algorithms correctly predicted the expected 4 distinct clusters that would represent the 4 different cell types in this assay. (E) Accuracy (proportion of correctly identified cells) of cell-type prediction using 8 different methods of sML (GLM, kNN, NN, MNN, RF, SVML, SVMR, and LDA) for each of the datasets. Box and whisker plots show the efficacy of these methods to recapitulate cell identity from these 2 sets of contigs as estimated by cross-validation (5 folds). To assess the efficacy of these methods on the full RNA-seq dataset, we used PCA for dimensionality reduction (i.e., >28,000 contigs to 38 PCs) while retaining 99% of the variance. Results are shown for raw data (Top row) and data scaled across contigs (Bottom row).

