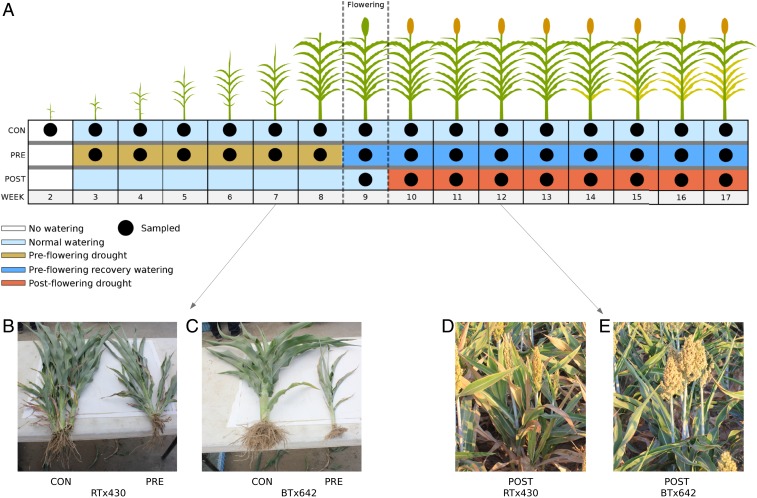
Fig. 1.
Experimental design. (A) Schematic overview of the experimental design for control (CON), preflowering (PRE), and postflowering (POST) drought. Black dots represent whether plants were sampled for the specified treatment/week, and the color of the boxes reflects the irrigation status for the plants (light blue, watered; brown, preflowering drought; dark blue, watered, preflowering recovery; red, postflowering drought); no plots were irrigated prior to week 3 (white boxes). All samples marked as “watered” were irrigated 5 d prior to sample collection. Samples from week 3 of preflowering drought and week 10 of postflowering drought are considered the 1st samples of drought-exposed plants from the 2 drought regimes (i.e., the 1st samples experiencing different watering regimes from control; Materials and Methods). (B and C) Photos of side-by-side comparisons of control (CON; left) and preflowering droughted (PRE; right) plants at week 7 for RTx430 (B) and BTx642 (C). (D and E) Field picture at week 12 after 3 wk of postflowering drought of RTx430 (D) and BTx642 (E), showing delayed senescence in this stay-green variety.

