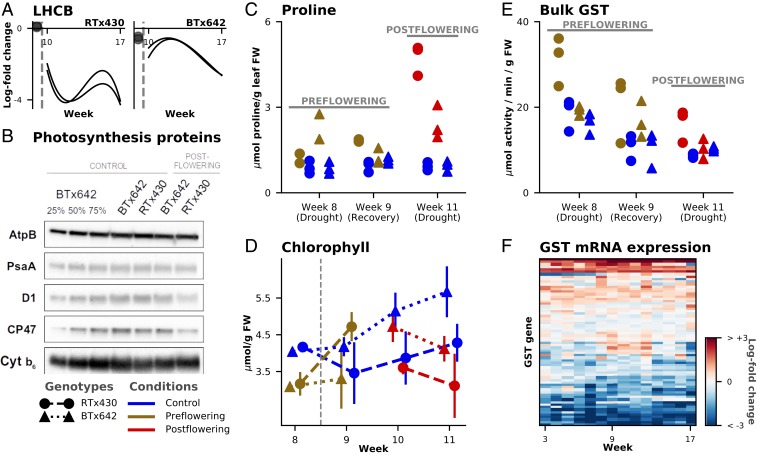
Fig. 3.
Stay-green phenotype, photosynthesis, and drought. (A) Two LHC PSII genes (LHCBs) (Sobic.003G209800 and Sobic.003G209900) show stronger down-regulation in RTx430 than BTx642 under postflowering drought stress. (B) Immunoblot analysis of representative subunits of photosynthetic complexes PSI (PsaA), PSII (D1 and CP47), and cytochrome b6f complex (Cyt b6) under control and 3 wk postflowering drought (week 11) with ATP synthase (AtpB) as a loading control (additional replicate is in SI Appendix, Fig. S15). (C) Proline levels determined on fresh weight (FW) leaf samples via a ninhydrin spectrophotometric assay for both drought conditions and genotypes. (D) Average value of 3 HPLC assays of total chlorophyll levels (y axis) plotted against week (x axis) showing constitutive differences between BTx642 and RTx430 after flowering and a sharp increase in chlorophyll levels under preflowering drought of RTx430; bars indicate ±SD intervals. (E) Bulk GST enzymatic activity in leaf extracts (y axis) at 3 timepoints (x axis). (F) Heatmap of centered log2 difference between the constitutive gene-expression values of RTx430 and BTx642 for the 68 expressed GST genes.

