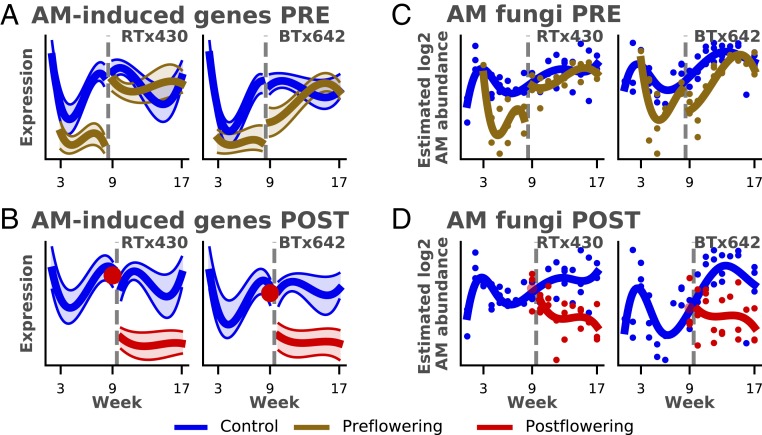
Fig. 4.
Symbiosis of AM fungi and sorghum under drought. (A and B) Average scaled gene expression of genes in the cluster highly overlapping in AM-induced genes (y axis) plotted against week (x axis) for preflowering drought (PRE; A) and postflowering drought (POST; B). (C and D) AM fungal abundance estimates (y axis; Materials and Methods) plotted against week (x axis) for preflowering drought (C) and postflowering drought (D) show the correlation of AM fungal abundance with the gene expression of the AM-induced genes. Gray dashed vertical line indicates the respective watering changes for the 2 drought regimes (Fig. 1).

