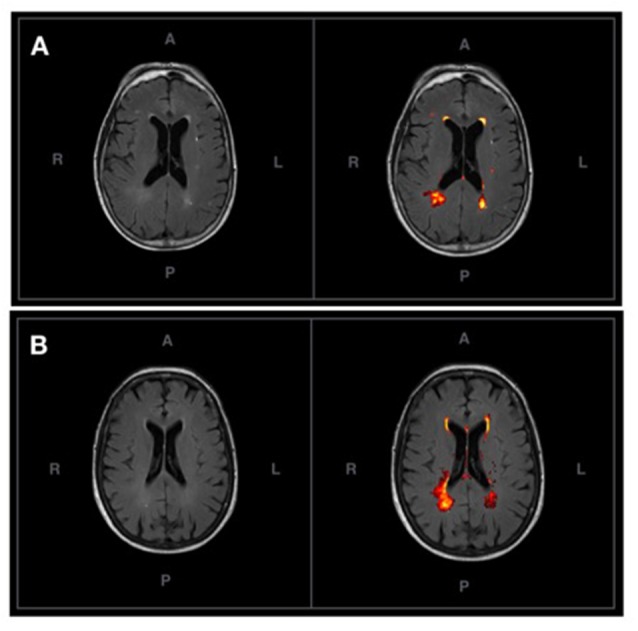
Figure 2.

(A) An axial T2-FLAIR image of a prototypical participant from the control group (left) and associated probabilistic lesion volume map (right) generated by the LST-LPA. (B) An axial T2-FLAIR image of a prototypical participant with SCD (left) and associated probabilistic lesion volume map (right) generated by the LST-LPA. Prototypical SCD and healthy control participants were selected based on the proximity of their white matter (WM) lesion burden to their respective group means.
