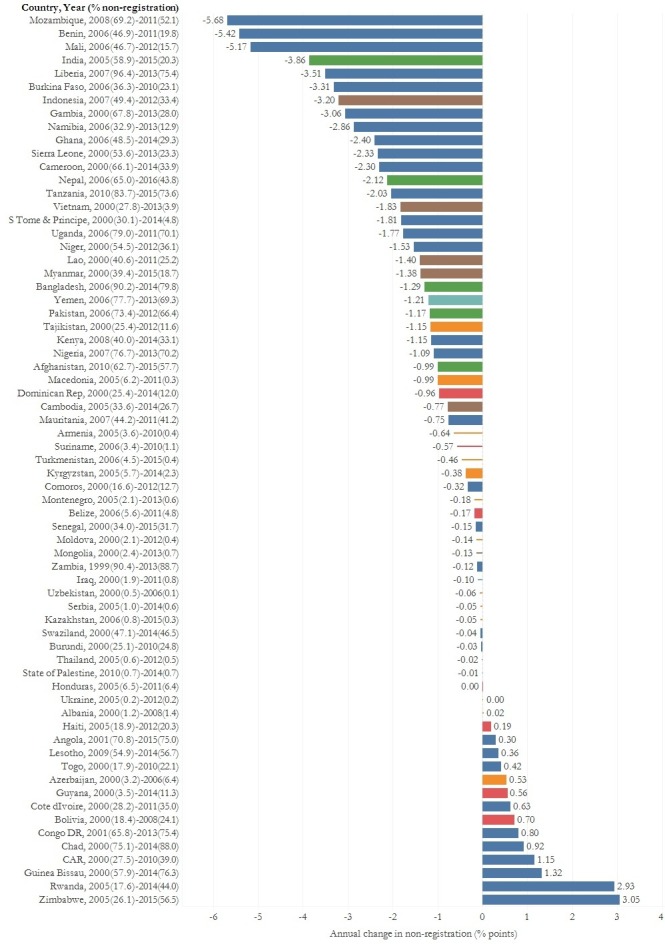
Figure 2.

Annual change in the percentage of children without birth registration between the first and most recent survey in low-income and middle-income countries. Country information includes the year of the first and most recent survey used to calculate annual change and the % of children without birth registration at each time point. Lines represent the 14 countries which have achieved complete birth registration coverage (non-registration<=5%) and bars represent the 53 countries which have not achieved complete birth registration coverage.
