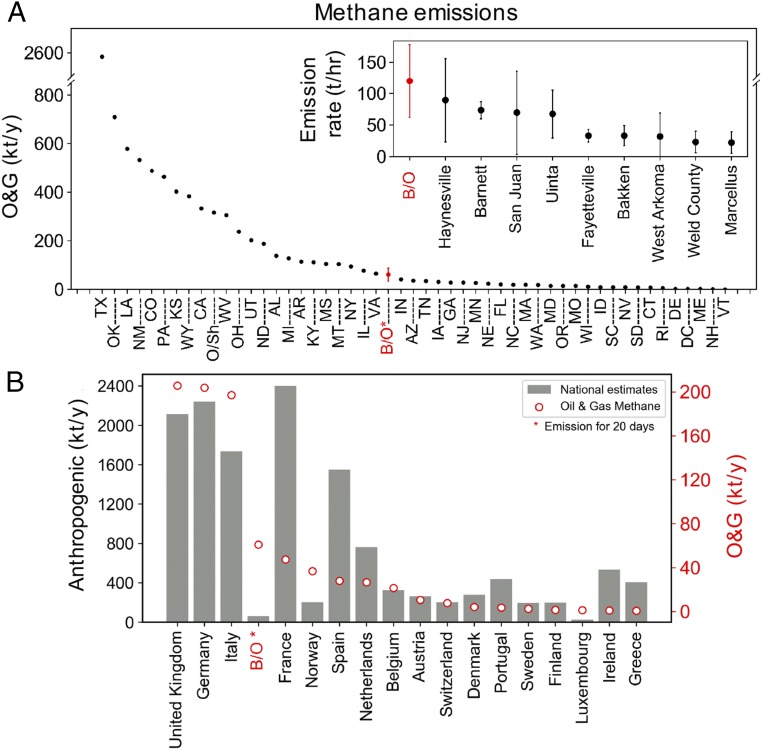
Fig. 3.
Comparison of CH4 emission from the blowout (B/O) with regional emissions. (A) Annual O&G emissions from individual states in the United States (and US offshore emissions shown by “O/Sh”), reported for year 2012, derived from the spatially disaggregated EPA gridded inventory (19). Inset shows the CH4 emission rate from 9 O&G basins in the United States reported by Alvarez et al. (9), with error bars showing 95% confidence interval derived assuming a standard normal error distribution; Marcellus is reported for northeast Pennsylvania only (9). (B) Annual O&G (red circles, right-hand y axis) and total anthropogenic emissions (vertical bars, left-hand y axis) from different European Union countries (plus Switzerland and Norway) as reported to the UNFCCC (23).

