Fig. 1.
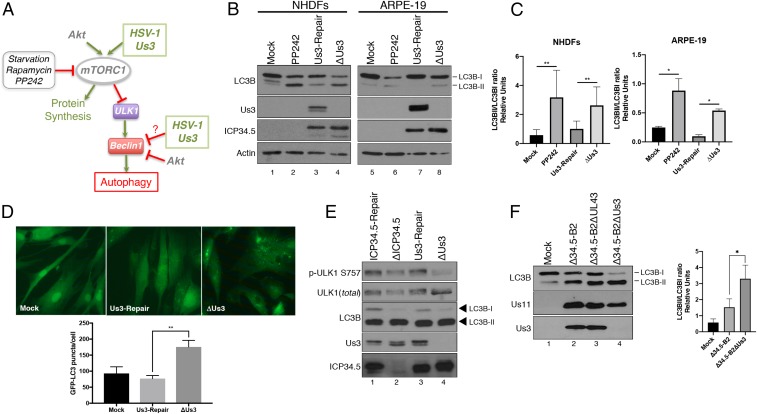
Suppression of autophagy in HSV-1–infected cells requires the virus-encoded Us3 Ser/Thr kinase. (A) Illustration depicting the control of autophagy by mTORC1 and the action of cellular and HSV-1–encoded effectors. Activation of proteins or cellular processes is shown by green arrows, while inhibitory actions are shown by perpendicular red lines. (B) NHDFs or ARPE-19 cells were mock infected (+/−PP242) or infected (multiplicity of infection [MOI] = 5) with a Us3-deficient virus (ΔUs3), or a virus where the Us3 deficiency was repaired (Us3-Repair). At 12 hpi, total protein was fractionated by SDS/PAGE and analyzed by immunoblotting with the indicated antibodies. Migration of unmodified LC3B-I and lipidated LC3B-II in this representative image are indicated on the Right of the panel. (C) The abundance of LC3B-I and LC3B-II in independent replicate experiments (n = 4 for NHDFs; n = 3 for ARPE-19) shown in B were quantified using Licor Image Studio software and expressed graphically as the LC3BII/LC3BI ratio. Error bars represent mean ± SEM. **P < 0.01; *P < 0.05 by paired t test. (D) Quantification of GFP-LC3B puncta (autophagosomes) in NHDFs stably expressing GFP-LC3B following infection with the indicated virus for 12 h. Error bars represent the mean ± SEM of at least 3 experiments where >50 cells were analyzed per experiment. **P < 0.01 by Student’s t test. Representative images (63× magnification) are shown above the graph. (E) NHDFs were infected (MOI = 5) with an ICP34.5-deficient virus (ΔICP34.5), a virus where the ICP34.5 deficiency was repaired (ICP34.5-Repair), ΔUs3, or Us3-Repair virus. At 12 hpi, total protein was isolated, fractionated by SDS/PAGE, and analyzed by immunoblotting using the indicated antibodies. (F) NHDFs were mock infected or infected (MOI = 1) with the ICP34.5-deficient parent virus (Δ34.5-B2), an ICP34.5 and UL43 doubly deficient virus (Δ34.5-B2ΔUL43), or an ICP34.5 and Us3 doubly deficient virus (Δ34.5-B2ΔUs3). Total protein harvested at 16 hpi was analyzed as in A. A representative image is shown (Left). The LC3BII/LC3BI ratio was quantified as in C from 3 (n = 3) separate experiments (Right). Bars represent mean ± SEM. *P < 0.05 by Student’s t test.

