Fig. 2.
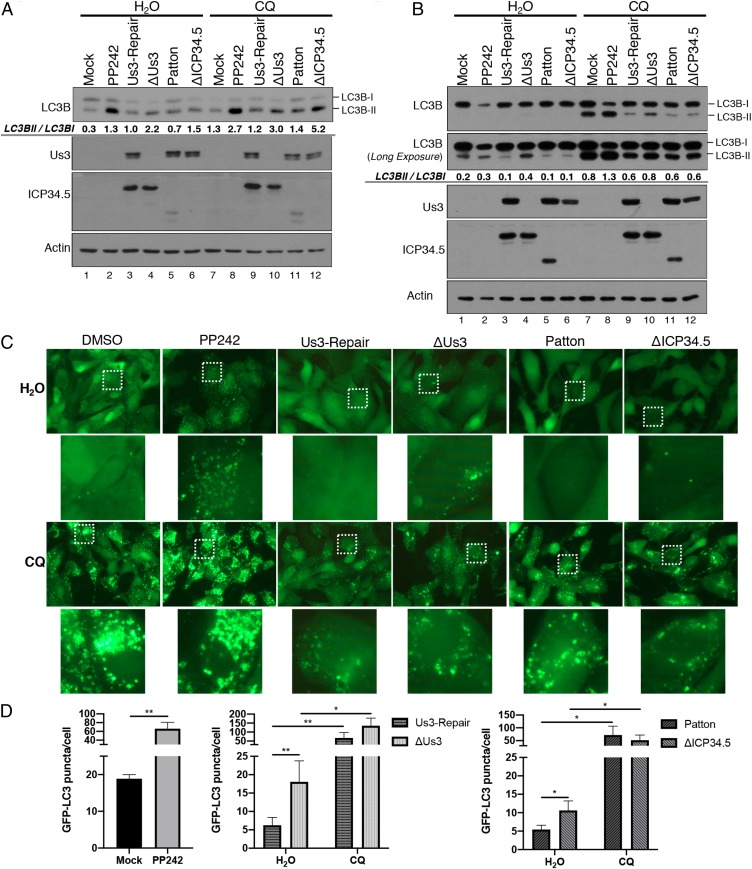
Inhibition of autophagy induction, but not autophagic flux, in HSV-1–infected cells is dependent upon Us3. NHDFs (A) or ARPE-19 cells (B) were mock infected or infected (MOI = 5) with HSV-1 ΔUs3 strain F, Us3-Repair strain F, wild-type HSV-1 (strain F or Patton), or ΔICP34.5 strain Patton. At 8 hpi, cells were treated with DMSO, PP242, or chloroquine (CQ) as indicated. At 12 hpi, total protein was isolated, fractionated by SDS/PAGE, and analyzed by immunoblotting with the indicated antibodies. LC3B-I and LC3B-II abundance in each representative images (n = 2) was quantified using Licor Image Studio Software and expressed numerically as the LC3BII/LC3BI ratio below the LC3B immunoblot panel. Failure to detect a 2-fold difference in LC3BII/LC3BI ratio in Fig. 2B lanes 5 and 6 likely reflects the nonlinearity of the chemiluminescent detection and the greater accuracy and linearity of manually counting GFP-LC3 puncta shown in C and D. (C) Representitive images (63× magnification) of GFP-LC3B puncta (autophagosomes) in ARPE-19 cells stably expressing GFP-LC3B that were infected and treated as in B. Higher magnification images (265× magnification) representing white boxed areas are shown below each panel. (D) Quantification of GFP-LC3B puncta in ARPE-19 cells stably expressing GFP-LC3B that were infected and treated as in B. Comparisons were performed between viruses derived from the same parent strain (strain F: ΔUs3 vs. Us3-Repair; strain Patton: WT Patton vs. ΔICP34.5). Error bars represent mean + SEM of triplicate samples with >150 cells analyzed per sample. Statistical analysis was performed by paired t test using the Bonferroni correction for multiple comparisons. *P < 0.05; **P < 0.01.

