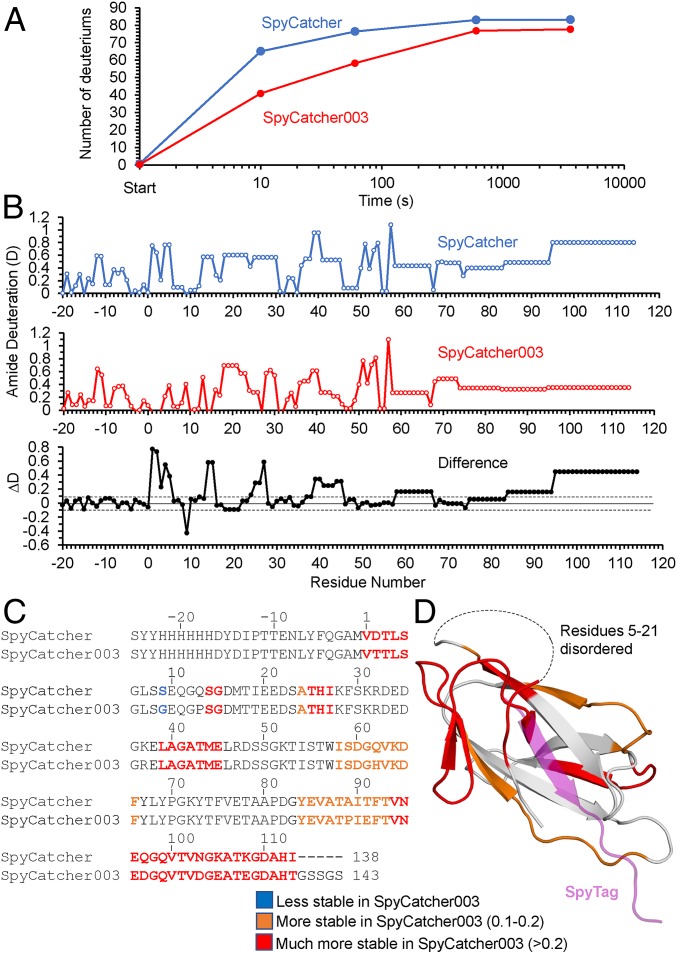
Fig. 3.
HDX analysis of SpyCatcher and SpyCatcher003. (A) Time course of deuterium uptake by SpyCatcher (blue) and SpyCatcher003 (orange) after mixing with D2O at 25 °C, determined by mass spectrometry. (B) Combined top-down and middle-down MS analysis of deuterium uptake at the single-residue level for SpyCatcher (Top) and SpyCatcher003 (Middle). Bottom shows the difference in deuteration (ΔD) from SpyCatcher minus SpyCatcher003 values. The dotted lines represent ±0.1 errors in deuteration. (C) Difference in deuterium exchange from B compared with amino acid sequence for SpyCatcher and SpyCatcher003. Blue shows the 1 residue more stable in SpyCatcher than SpyCatcher003. Orange shows residues with 0.1 to 0.2 extra stability in SpyCatcher, and red shows those with >0.2 difference. (D) Difference in deuterium exchange mapped on the domain structure (based on PBD 2X5P), color-coded as in C. SpyTag residues are shown in purple.

