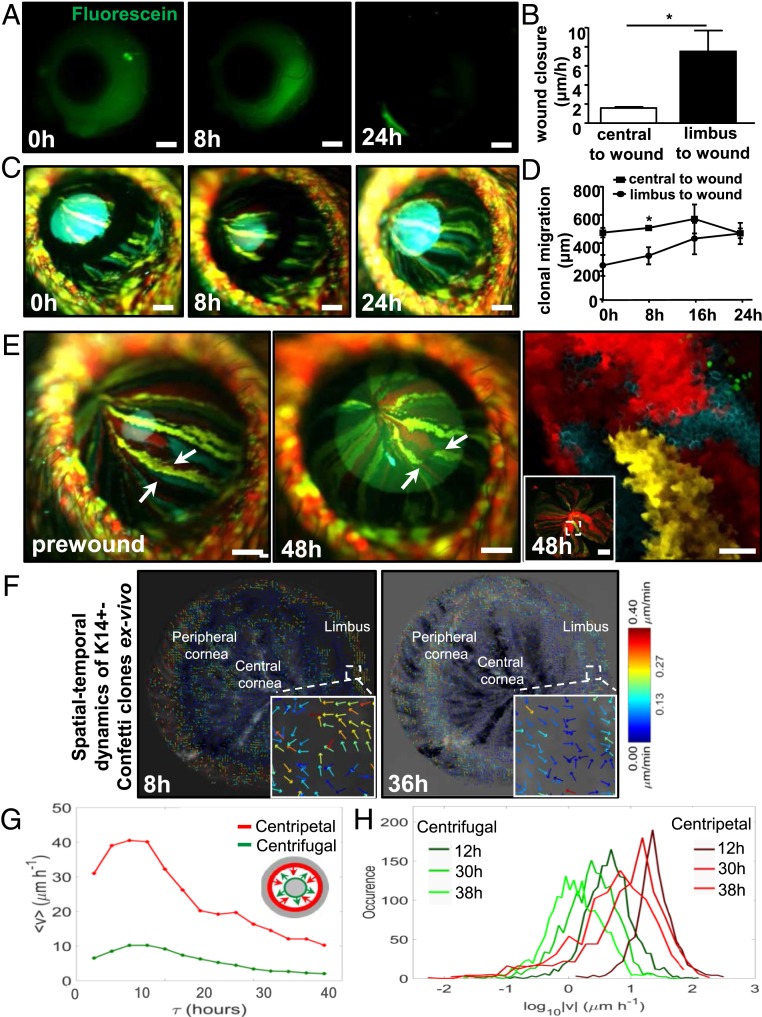
Fig. 2.
Centripetal verses centrifugal migration. See also Movies S1 and S2. (A) Corneas of live WT mice (n = 4/group) were monitored by applying sodium fluorescein (green) at 0, 8, and 24 h post a type II annular wound. (Scale bars, 400 μm.) (B) In vivo wound-closure rate in WT mouse corneas following a type II annular wound, comparing centripetal (limbus-to-wound) to centrifugal (central-to-wound) velocity (mean ± SD, n = 4/group, *P < 0.05, unpaired 2-tailed Welch’s t test). (C) In vivo monitoring of clonal streaks in Confetti transgenic mice (n = 3/group). Displayed are images taken at 0, 8, and 24 h post a type II annular injury. (Scale bars, 400 μm.) (D) In vivo Confetti streak displacement postannular wounding, comparing centripetal (limbus-to-wound) to centrifugal (central-to-wound) velocity (mean ± SD, n = 3/group, *P < 0.05, unpaired 2-tailed Welch’s t test). (E) Confetti streaks were imaged in vivo before (prewound, first panel) and 48 h after injury (second panel). Arrows point to the same region. (Scale bars, 400 μm.) The same corneas were flat-mounted and viewed by confocal microscopy (third panel). The region encompassed by the hatched square (Inset) is magnified. (Scale bars, 100 μm and 500 μm [Inset].) (F) Eyes from Confetti mice (n = 4) were enucleated immediately after a type II wound, placed in organ culture, and imaged by light-sheet microscopy every 2 h for 48 h. STICS was applied on a time series of 2D maximum intensity projections of 3D image stacks. Vector flow-maps were generated after correcting for corneal curvature; each represent migration and direction of clone movement from images taken at 8 and 36 h, respectively. Insets are magnified views of a representative region encompassed by the small hatched square to show the multidirectional movement of groups of cells within a clone, depicted as colored arrows with an associated heat-map which acts as a speed gauge. (G) Ex vivo Confetti streak displacement following a type II annular wound, comparing centripetal (limbus-to-wound, red) to centrifugal (central-to-wound, green) velocity. The speed of fluorescent clones from 0 to 40 h for a representative cornea is displayed. A schematic representation of an annular wound is also included. Here, arrows are color-coded with the line graphs in the main panel to indicate the direction of wound closure. The gray area represents intact epithelia. (H) Ex vivo Confetti clone speed at representative time points of 12, 30, and 38 h postwound is displayed by individually colored histogram (centrifugal migration, dark to light green; centripetal migration, burgundy to red).

