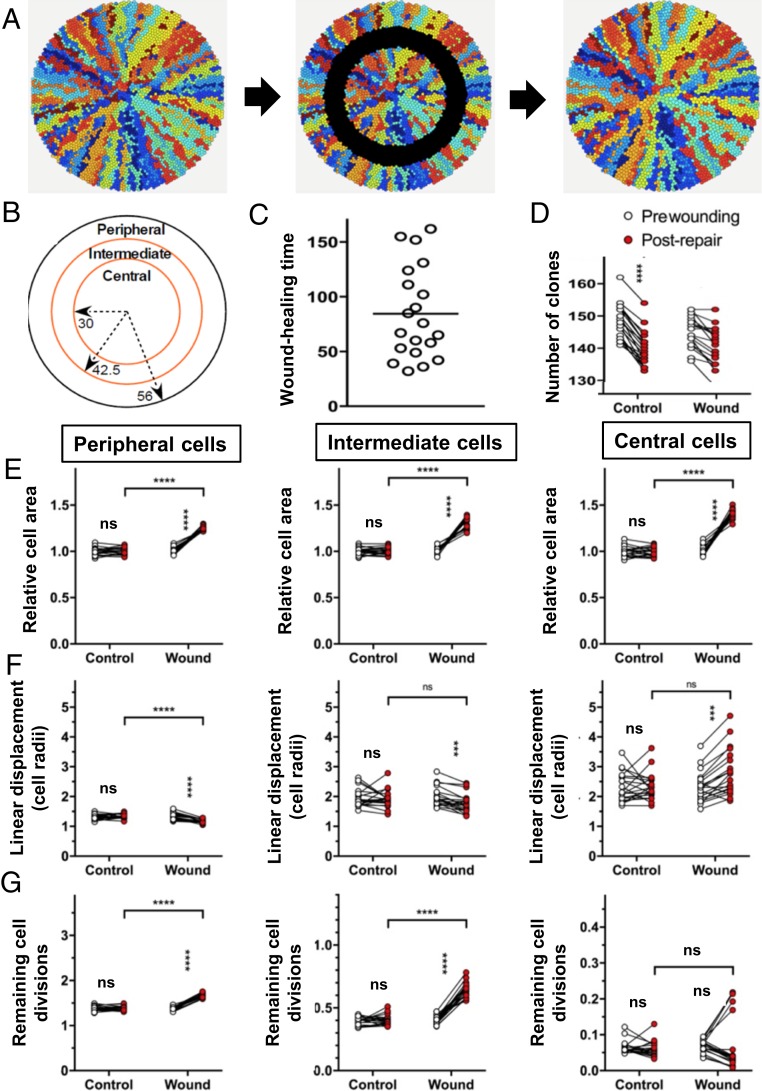
Fig. 6.
Computational modeling to investigate the effect of wounding on the composition and structure of the repaired corneal epithelium. See also Movie S3 and Table 1. (A) Examples of simulated corneas immediately before, during, and immediately after wound repair (left to right, respectively). (B) Wounds were made by removing epithelial cells from an intermediate zone, i.e., between 42.5 and 30 cell radii from the center. (C) Cell properties were measured in these regions and in the peripheral zone. Wounds were completely repaired in less than 200-time steps. (D) Clone number was counted prewounding and postrepair. (E) Cell size was measured for all cells in each zone immediately before wounding and immediately after healing was complete or, in the case of unwounded corneas, at t = 2300 (“prewounding”) and t = 2500 (“postwounding”). Cell size was adjusted for differences in prewounding size, which varied in the 3 zones. The mean cell area is plotted for each cornea in the peripheral, intermediate, and central zone. (F) The mean linear displacement, a measure of clonal dispersion, was determined for all cells in the peripheral, intermediate, and central zones, as indicated below the X-axis. (G) TAC (n), the number of remaining cell divisions of the TACs in corneas was determined for all cells in the peripheral, intermediate, and central zones, as indicated below the X-axis. Data (D–G) represent mean ± SD, n = 20/group, ***P < 0.001, ****P < 0.0001, ns (not significant) = P > 0.05 by repeated measures (2300-time unit) one-way ANOVA with Sidak’s multiple comparisons correction.

