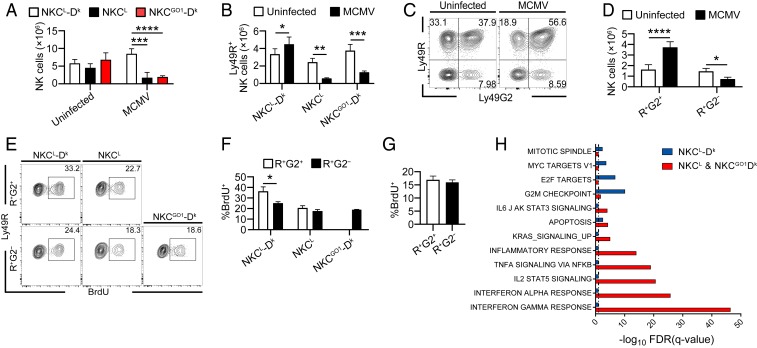
Fig. 5.
Ly49G2 promotes Ly49R+ NK cell accumulation, proliferation, and differential gene expression during MCMV infection. (A and B) Total NK cells and Ly49R+ NK cells from the spleens of uninfected mice and mice 4 dpi. (C and D) Distribution profiles of Ly49R and Ly49G2 on NK cells in naïve mice or mice 4 dpi. NKCL-Dk mice. Representative flow plots are shown in C. Quantified numbers of R+G2− and R+G2+ subsets are shown in D. (E and F) BrdU incorporation after 3-h pulse BrdU treatment 4 dpi. (G) BrdU incorporation after 3-h pulse BrdU treatment 3 d after pIC injection. In A–F, mice were infected with 5 × 10⁴ PFU MCMV. (H) Selected hallmark genes and corresponding gene enrichment analysis of NKCL-Dk splenic NK cells. Data are representative of 3 to 6 independent experiments with 3 to 4 mice per group. (G) Data are representative of 2 independent experiments with 3 to 4 mice per group. Error bars indicate mean ± SD. *P < 0.05, **P < 0.01, ***P < 0.001, ****P < 0.0001.

