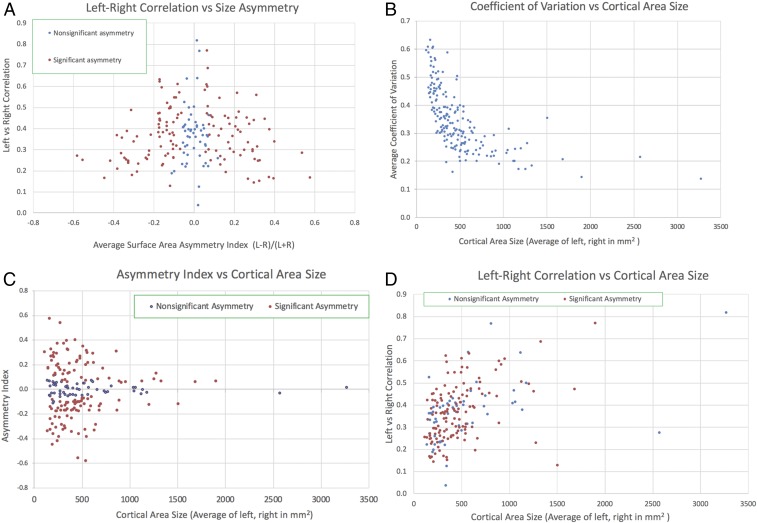
Fig. 4.
Left vs. right hemisphere areal correlations and asymmetries in the human HCP_MMP1.0 cortical parcellation. (A) Scatterplot of an asymmetry index ([L − R]/[L + R]) on the horizontal axis, reflecting differences in the average surface area for the left vs. right hemispheres, vs. the correlation between left and right hemisphere area size (vertical axis) in 446 individual subjects (210P, 210V, plus parcellation training subjects). The small percentage of areas (4%) missing in individual subjects (23) is included in the averages. (B) Coefficient of variation (SD divided by the mean) for each area (computed separately for the left and right hemispheres and then averaged) as a function of mean area size (averaged across hemispheres). (C) The left–right average surface area asymmetry index as a function of mean area size. The 52 areas that lack significant asymmetry after multiple-comparisons correction (blue dots) all have low asymmetry indices (<0.13) but span the full range from very small to the largest cortical areas. The 128 areas having significant asymmetry fractions span nearly the full range of cortical area sizes but are weighted toward smaller areas. (D) Left–right correlation values vs. cortical areal size. Correlation values tend to increase with areal size, but they vary widely (several-fold or more) for all major size ranges and are comparable for areas that have significant vs. nonsignificant asymmetry fractions (red vs. blue dots).

