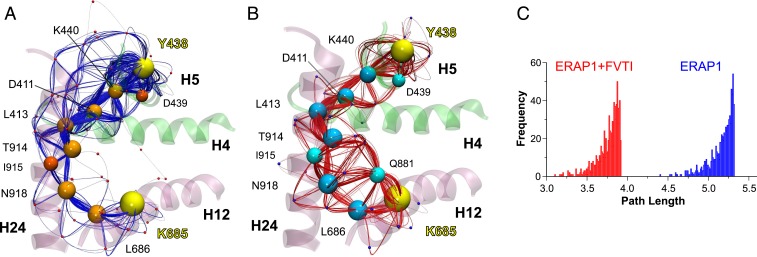
Fig. 5.
(A and B) Schematic illustration of calculated paths along networks of correlated residue motions between residues Tyr438 and Lys685 (yellow spheres) that interact with the N and C termini of the 15-mer substrate. The communicating paths are color-coded with blue splines and orange nodes (residues center of mass) for ERAP1 (A) and red splines with cyan nodes for FVTI-bound ERAP1 (B). Residues that belong to the optimal (shortest) pathway are shown using larger spheres, and helices H4 (396 to 411), H5 (435 to 452), H12 (670 to 688), and H24 (906 to 936) are color-coded according to ERAP1 domain. (C) Histograms of the 750 path lengths calculated from the dynamical network analysis of ERAP1 in the absence (blue bars) or presence (red bars) of FVTI. The distribution associated with the MD simulations in the presence of FVTI is shifted toward shorter lengths, indicating a stronger dynamical coupling on FVTI binding. Note that here, “length” is not related to the Cartesian space but rather refers to spans in functionalized correlation space.

