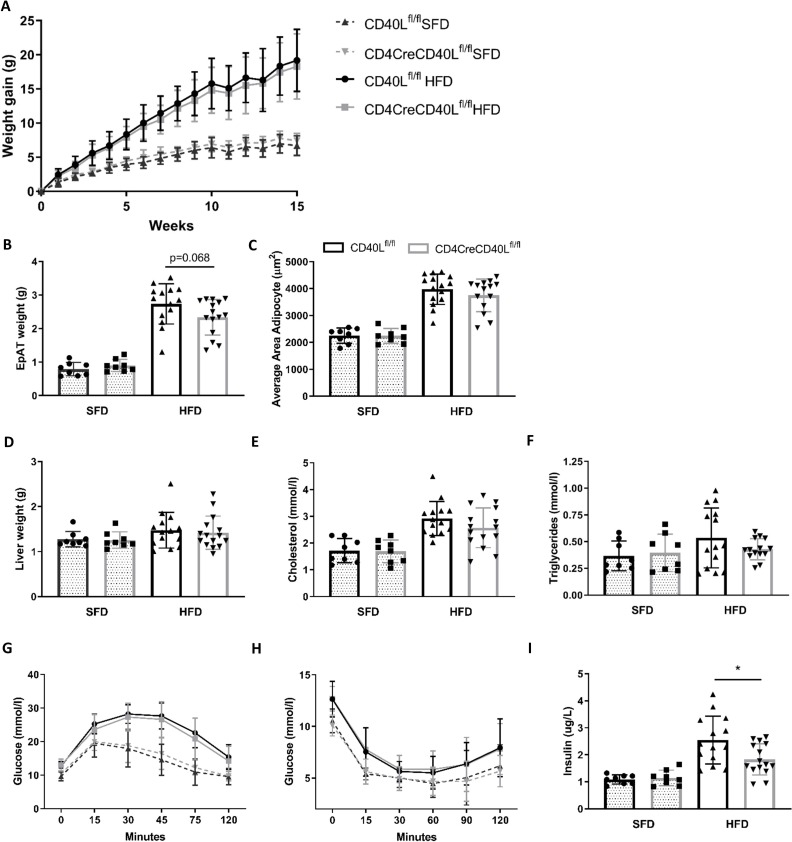
Figure 1.
Weight gain, glucose and insulin tolerance tests show no differences between WT and T cell CD40L deficient mice. (A) Body weight gain of HFD (n=14 and 15/group) and SFD (n=8/group) of CD4CreCD40Lfl/fl and WT mice during 15 weeks of diet. (B) Epididymal adipose tissue weight (EpAT) after 15 weeks of diet. (C) Average adipocyte size in area (µm2) for HFD and SFD. (D) Liver tissue weight after 15 weeks of diet. (E, F) Plasma cholesterol and triglyceride concentrations in mmol/L. (G) Glucose tolerance tests HFD (n=15/group) and SFD (n=8/group) at week 12 of dietary intervention. (H) Insulin tolerance tests HFD (n=15/group) and SFD (n=8/group) at week 12 of dietary intervention. (I) Insulin concentration in plasma of mice fasted for 5 hours. Data are presented as mean±SD, *p<0.05. HFD, high fat diet; SFD, standard fat diet; WT, wild type.

