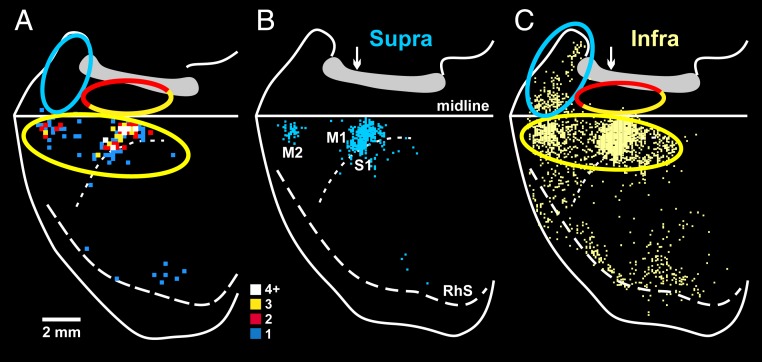
Fig. 5.
Origin of cortical inputs to the rat kidney. (A) These results were obtained after a survival time that allowed retrograde transneuronal transport of RV that was limited to cortical neurons in layer V (Fig. 1). The results are displayed as the number of labeled neurons in a 200-μm bin (color key). (B and C) These results were obtained after a survival time that allowed retrograde transneuronal transport of RV to label cortical neurons in supragranular (B) and infragranular (C) layers (Fig. 1). Each square represents a labeled neuron. White arrow, bregma. Rostral is to the left. Conventions and abbreviations are as in Figs. 2 and 4. Adapted from ref. 82.

