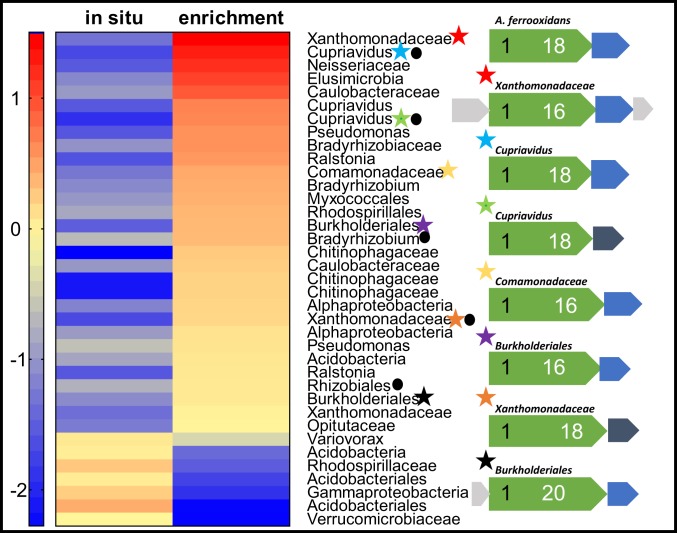
Fig. 3.
Heat-map comparison of high-quality MAG abundance (log genomes per million reads) and taxonomy between the in situ bedrock–saprolite interface sample (785-cm depth) and quartz diorite-oxidizing enrichment culture from the same inocula. Stars indicate the presence of homologs to the model Cyc2 iron-oxidation system of A. ferrooxidans. Corresponding gene maps (indicated by star color) are shown for each Cyc2 homolog, compared to the model (top). Extracellular or outer-membrane putative Cyc2 proteins (green) are scaled to the size of the protein, with the number of N-terminal heme binding motifs indicated in black and C-terminal transmembrane domains in white. Periplasmic electron carriers including monoheme c-type cytochromes (blue) or high potential iron–sulfur proteins (dark gray) and hypothetical proteins (light gray) are also indicated. Presence of RuBisCo is indicated by a circle.

