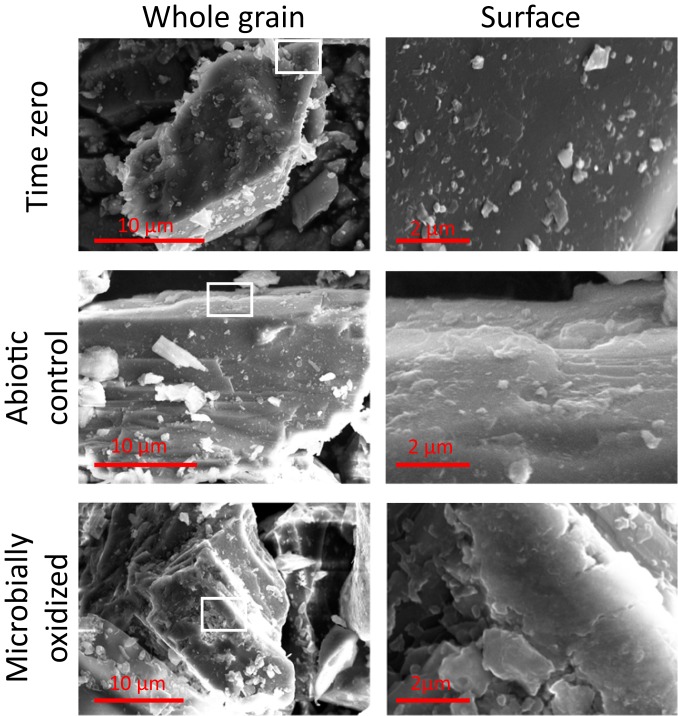
Fig. 5.
FE-SEM images of hornblende at the whole-grain scale (Left) and surface scale (Right). Note the differences in scale on whole-grain images, as individual grain sizes are variable. For consistency, surface images are at the same scale. The approximate area of the hornblende surfaces is outlined in white on the grain-scale image.

