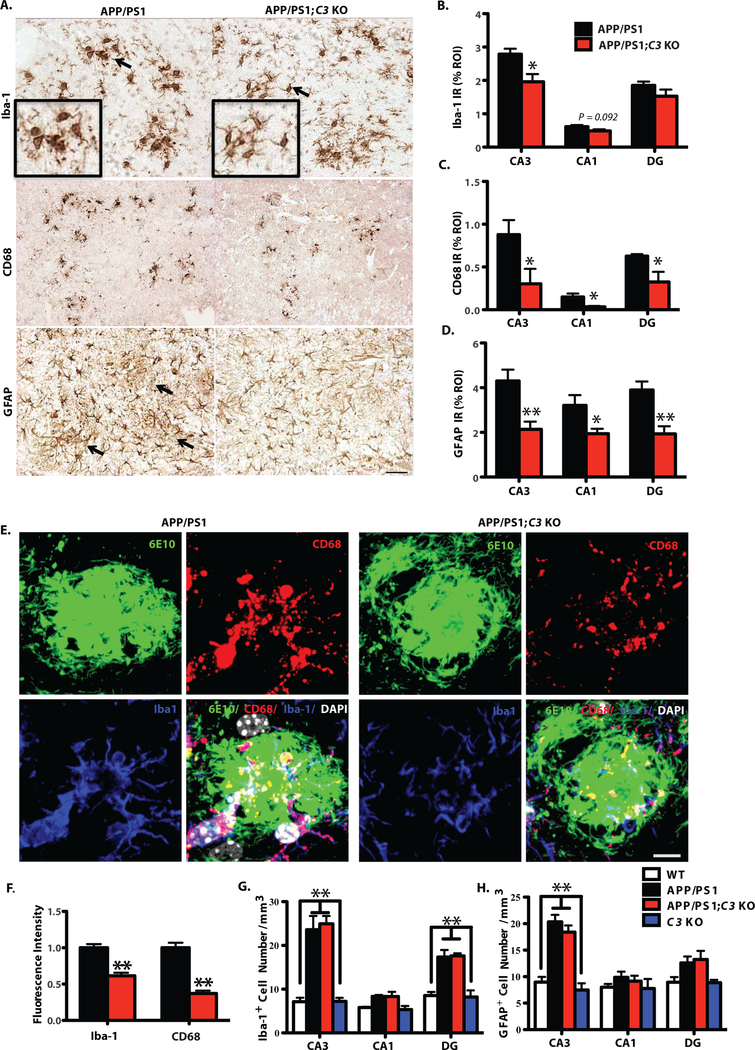
Fig. 3.

Morphological changes associated with glial activation were reduced in 16-month-old APP/PS1;C3 KO mice. A. Iba-1 IR and CD68 IR show less microglia and macrophage activation (i.e. smaller cells with thinner processes) and less GFAP IR astrocytic clustering in hippocampal CA3 in 16-month-old APP/PS1;C3 KO mice compared to APP/PS1 mice. Scale bar = 50 μm. B-D. Quantification of Iba-1, CD68 and GFAP IR in hippocampal CA3, CA1 and DG shows reduced glial IR in APP/PS1;C3 KO mice compared to APP/PS1 mice (* p < 0.05, ** p < 0.01, n=6–8; 3 equidistant planes, 300μm apart; independent unpaired t-tests per region). E. High-resolution confocal images of Aβ plaques (6E10), microglia/macrophages (Iba-1) and phagocytic cells (CD68) in hippocampal CA3 indicate reduced phagocytosis in APP/PS1;C3 KO mice compared to APP/PS1 mice. Scale bar: 10 = μm. F. Iba-1+ and CD68+ immunofluorescent intensities were significantly lower in APP/PS1;C3 KO mice compared to APP/PS1 mice (** p < 0.01, n=5, independent unpaired t-tests per marker). G.H. Stereological counts of Iba-1 IR (G) and GFAP IR (H) cells (DAB staining) were performed in hippocampal CA3, CA1 and DG. The number of Iba-1 IR microglia/macrophage cells was increased in CA3 and DG in APP/PS1 and APP/PS1;C3 KO mice vs. WT and C3 KO mice (G), whereas the number of GFAP IR astrocytes was increased only in CA3 (H); however, no differences were observed in glial cell numbers between APP/PS1 and APP/PS1;C3 KO mice (** p < 0.01; n=6–8; 3 equidistant planes, 300 μm apart; one-way ANOVA with Bonferroni post-hoc test per region).
