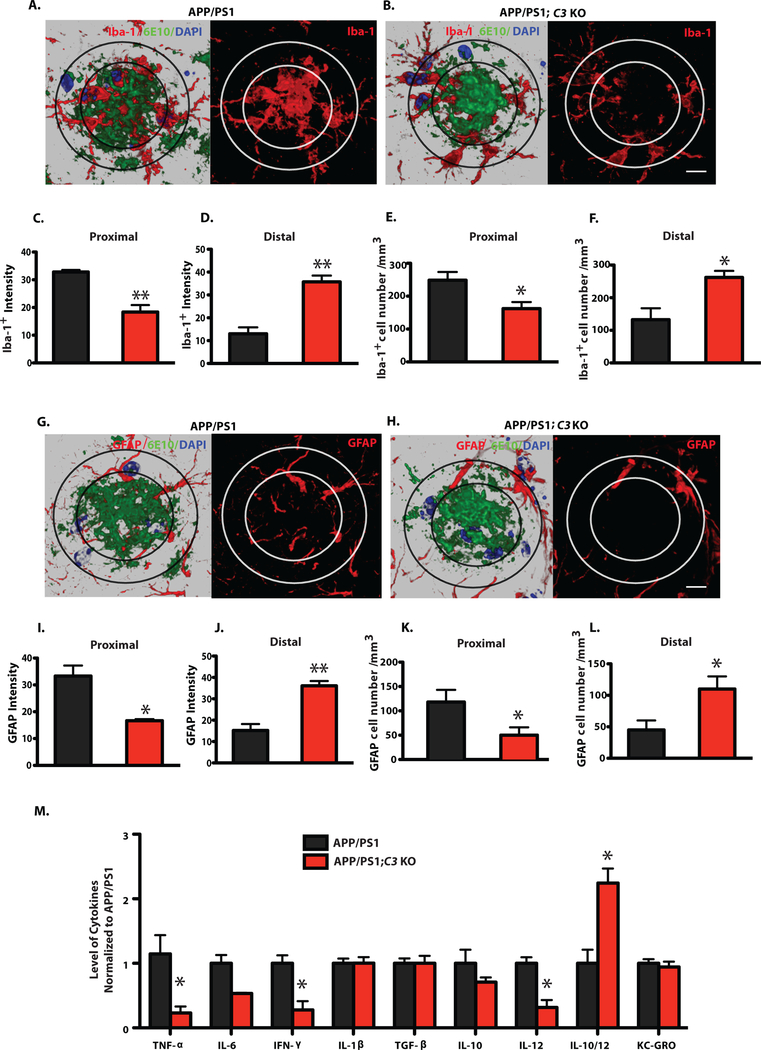
Fig. 4.
Plaque-associated microglia and astrocytes and brain cytokine levels were altered in APP/PS1;C3 KO mice compared to APP/PS1 mice. A,B,G,H: High-resolution confocal images of Iba-1 (red)/6E10 (green)/DAPI (blue) or GFAP (red)/6E10 (green)/DAPI (blue) in APP/PS1 and APP/PS1;C3 KO mice. The inner ring indicates the proximal region of a plaque (i.e. the center) while the outer ring indicates the distal region. Scale bar = 10 μm C,D,I,J: Iba-1+ and GFAP+ intensities were lower in the Aβ plaque proximal area (C, I) and higher in the Aβ plaque distal area (D, J) in APP/PS1;C3 KO mice compared to APP/PS1 mice (*p < 0.05, **p < 0.01, n=6, unpaired t-test). E,F,K,L: The number of Iba-1+ and GFAP+ cells was reduced in the proximal plaque area in APP/PS1;C3 KO mice compared to APP/PS1 mice (E,K) (*p < 0.05) and increased in the distal plaque area (F,L) (*p < 0.05, n=6, unpaired t-test). M. Cytokine ELISA of brain homogenates revealed significant reductions in TNF-α, IFN-γ, and IL-12 and an increased IL-10/IL-12 ratio in 16 month-old APP/PS1;C3 KO mice compared to APP/PS1 mice (* p < 0.05; n=8; independent unpaired t-test per marker followed by Bonferroni correction for multiple comparisons).

