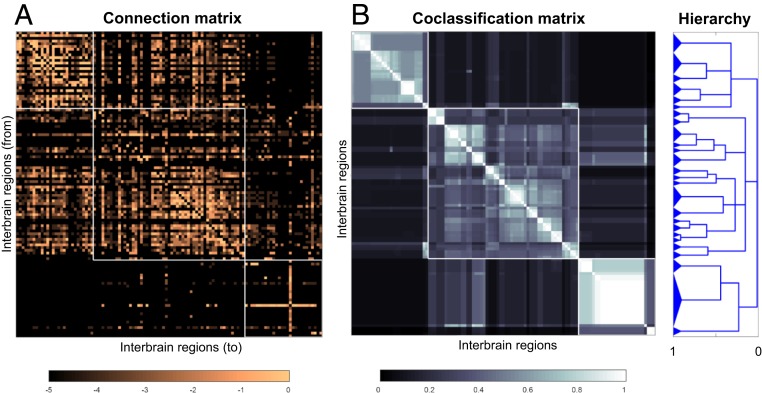
Fig. 6.
Connection and coclassification network matrices for the unilateral intrainterbrain (IB1) subconnectome. (A) Directed and weighted monosynaptic macroconnection matrix for IB1 with gray matter region (node) sequence in a modular or subsystem arrangement derived from MRCC analysis (shown in B). Connection weights are represented on a log10 scale (Bottom) and 3 top-level modules are outlined in white. (B) Complete coclassification matrix obtained from MRCC analysis (as in A) for the 111 interbrain regions on 1 side of the brain. A linearly scaled coclassification index (Bottom) gives a range between 0 (no coclassification at any resolution) and 1 (perfect coclassification across all resolutions). Ordering and hierarchical arrangement (Right) are determined after building a hierarchy of nested solutions (1,000,000 event samples) that recursively partition each cluster/subsystem, starting with the 3 top-level clusters/subsystems (IB1:M1 to M3). The 26 subsystems obtained for the finest partition are indicated on the left edge of the cluster tree, while the 3 top-level subsystems (corresponding to IB1:M1 to M3) appear at the root of the tree (far right edge). A total of 19 distinct hierarchical levels are present, as determined by the number of vertical cuts through each unique set of branches. The length of each distinct set of branches represents a distance between adjacent solutions in the hierarchical cluster tree that may be interpreted as its persistence along the entire spectrum; dominant solutions extend longer branches, while fleeting or unstable solutions extend shorter branches. All solutions plotted in the cluster tree survive the statistical significance level of α = 0.05.

