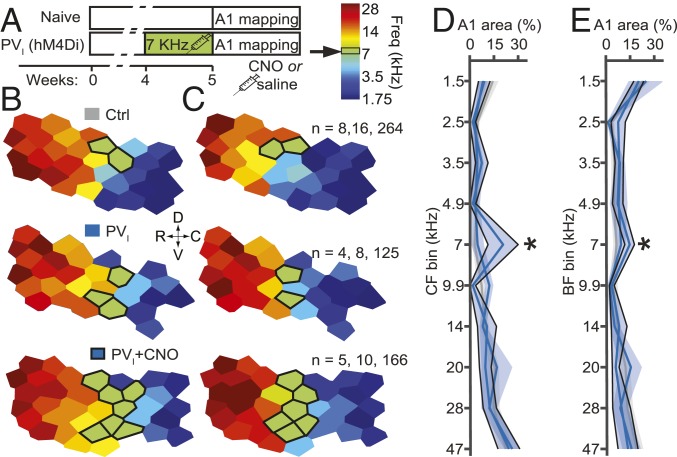
Fig. 2.
Silencing of PV+ interneurons reactivates A1 frequency tuning plasticity. (A) Experimental timeline. Examples of A1 tuning maps for (B) characteristic frequency (CF) and (C) best frequency at exposure intensity (BF). Outlined sites are tuned at 7 kHz ± 1/2 octave. All measures were evaluated by 2-way ANOVAs with bin and frequency as factors, followed by simple main effects tests and Tukey’s post hoc test for the bins centered on 7 kHz, relative to Ctrl. (D) CF. Interaction: both F(9,100) ≥ 2.5, P ≤ 0.01; 7-kHz bin: CNO, P ∼ 0, NaCl ∼ 1. (E) BF. Interaction: both F(9,100) ≥ 1.8, P ≤ 0.07; 7-kHz bin: CNO, P ∼ 0; NaCl, P = 0.99 (Dataset S1). n = number of subjects, recording positions, cortical sites per group.

